Compare the leadership styles your program teaches, with your own key points and optional source, side by side in one infographic for a workshop or team guide.
One generated image that sets your leadership styles side by side, each with its name and the points you supply, plus an optional source line. It does not rank the styles or add theory. Check every name and point before sharing.
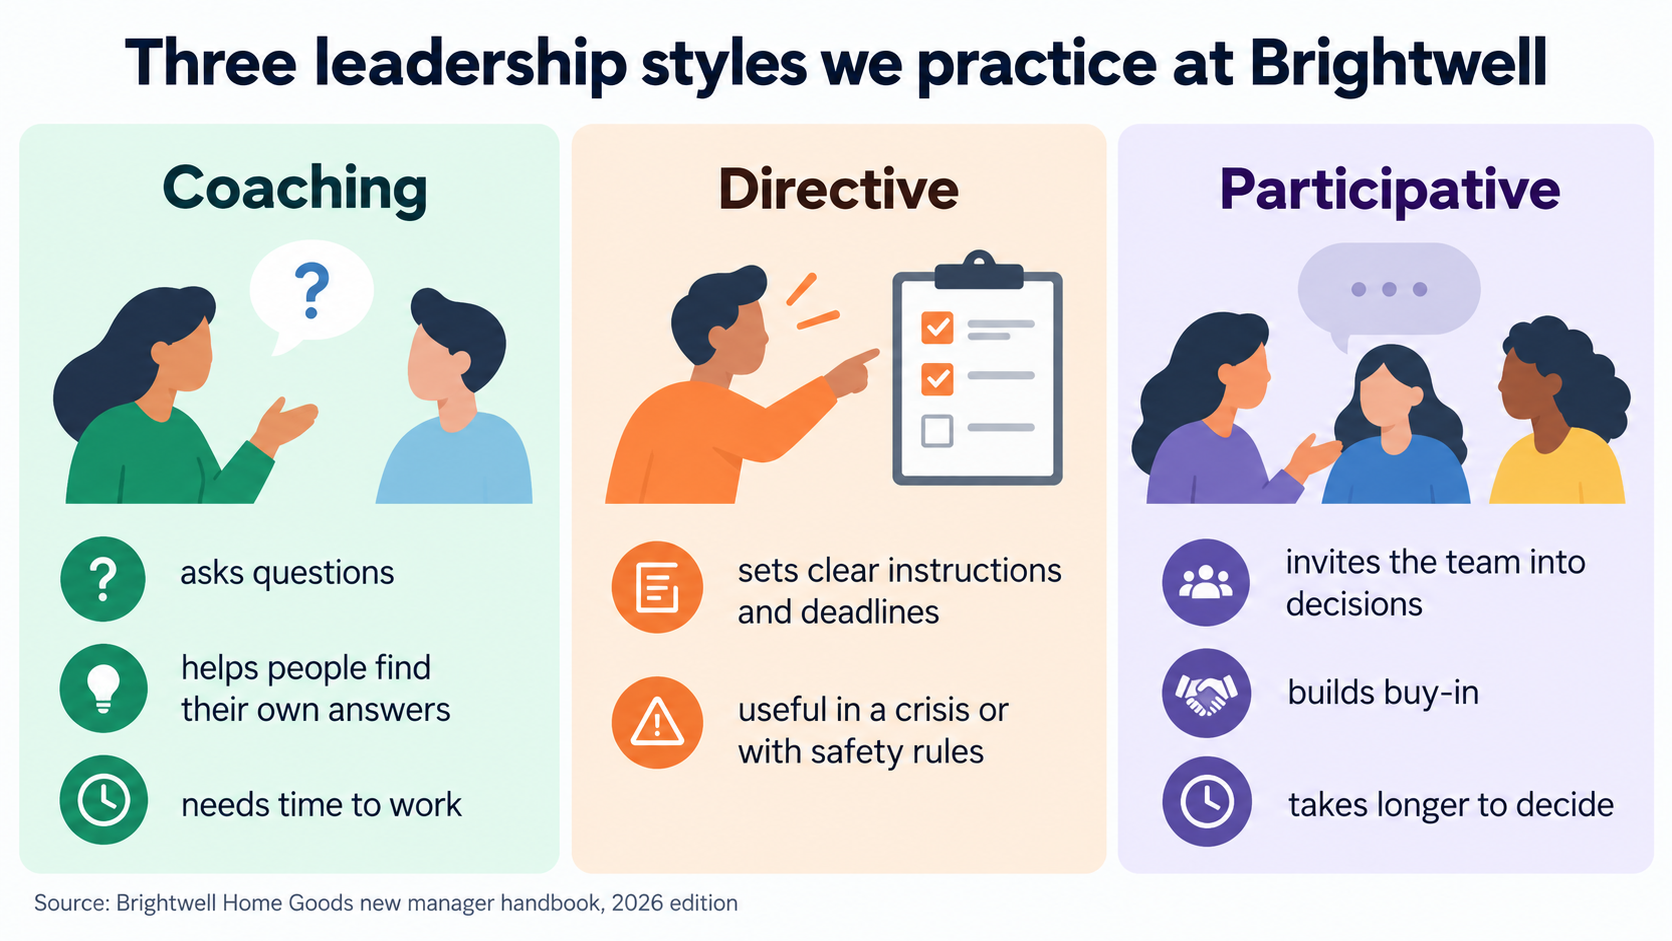
Coaching: asks questions, helps people find their own answers, needs time to work
Directive: sets clear instructions and deadlines, useful in a crisis or with safety rules
Participative: invites the team into decisions, builds buy-in, takes longer to decide
Source (optional)
Brightwell Home Goods new manager handbook, 2026 edition
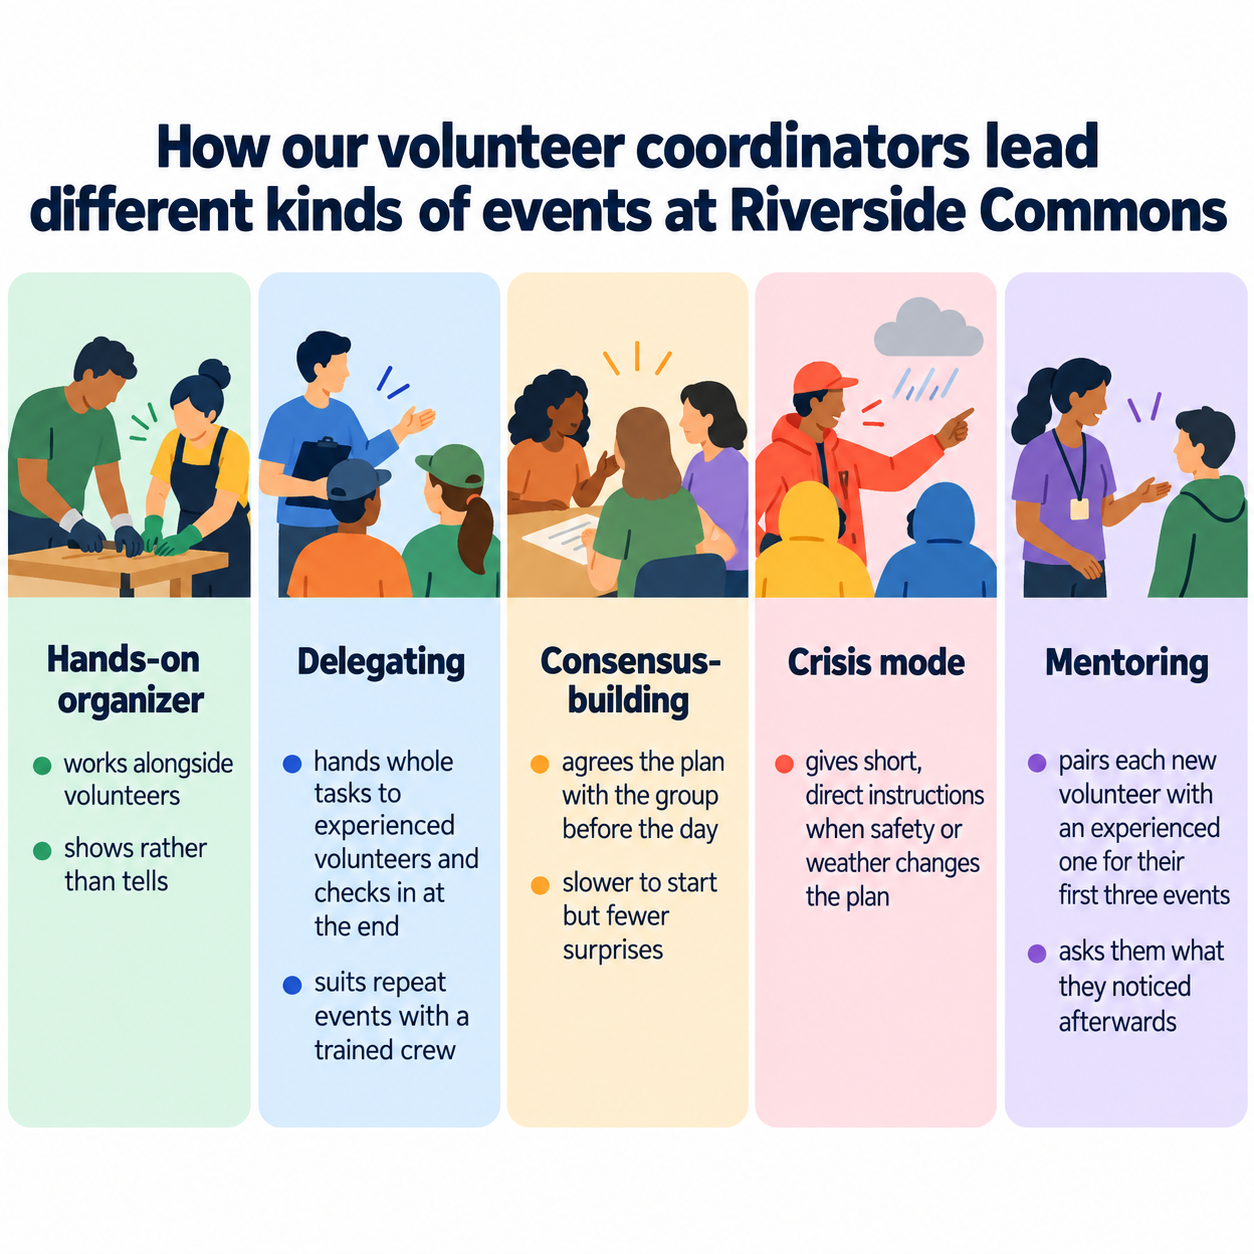
How our volunteer coordinators lead different kinds of events at Riverside Commons
Styles and their key points, one style per line
Hands-on organizer: works alongside volunteers, shows rather than tells
Delegating: hands whole tasks to experienced volunteers and checks in at the end, suits repeat events with a trained crew
Consensus-building: agrees the plan with the group before the day, slower to start but fewer surprises
Crisis mode: gives short, direct instructions when safety or weather changes the plan
Mentoring: pairs each new volunteer with an experienced one for their first three events and asks them what they noticed afterwards
Source (optional)
Left empty
Five styles, a long title and very uneven amounts of text, with no source. Checks the cards stay equal in weight, no style is ranked or given extra points, and no attribution appears.
Same task, three directions
Pick a direction to start from.
01
Side-by-side columns
Equal columns with a colored header per style, which makes the differences easy to compare across a row.
02
Equal card row
An equal-size card for each style, in your order, with no decision axis or inferred ranking.
03
Handout card grid
Square cards in a grid for a workshop handout or a team channel post.
What the template keeps
The parts that stay consistent.
01
Equal weight
Every style gets the same space, so the layout does not suggest a favorite.
02
Parallel points
Points line up across styles, which makes the differences you describe easy to see.
03
Your framework only
The styles and points are yours; no outside theory or famous names are added.
How to use it
From details to a result.
01
Title the comparison
Say what is being compared and for whom, for example the styles taught in your manager program.
02
Write each style on one line
Start with the style name, a colon, then two or three short points separated by commas.
03
Add a source if you have one
A handbook, course or workshop the styles come from. Leave it blank for no attribution.
04
Review, generate and check
The brief waits in Vizify for you to send it. Afterwards, check that each point sits under the right style.
Output boundaries
What to check before you use it.
Style names and points are drawn as image text. Long points are more likely to come back with errors, so keep each short and proofread. Uneven text can wrap or use an equal-card grid. If it still cannot fit legibly, shorten the supplied wording before generating; no style is silently summarized.
Two to five styles fit on one image. A full leadership framework or course needs several images or a document.
The template does not rank styles, cite research or name well-known leaders. It shows your program's points as supplied.
If you want to show team survey scores for each style, that is data and belongs in a chart from Vizify's chart tools.
You receive a picture, not an editable slide, so changing the wording means generating again.
The selected ratio guides composition. Check the actual image dimensions and print readability; no exact pixels, PDF, bleed, layers or editable chart are promised.
QuestionsCan I use this leadership template for a training day?+
Yes. Enter the styles your session covers with two or three points each, then use the wide format for a slide or the square format for a handout.
Will the leadership infographic say which style is best?+
No. Every style gets equal space and no scores. If your program recommends a style for a situation, write that into its points yourself.
Can I credit the author of the model we teach?+
Yes. Put the credit in the source field exactly as it should read. The template never adds an author or framework name by itself.
Can I compare styles using scores from our team survey?+
Survey scores are data and are best shown in a chart where each value is plotted exactly. You can mention one or two scores in the points, but check them carefully on the result.