One generated image showing your career stages as connected steps along a path, with the skills for each stage beneath it. It shows the route you describe and adds no salaries, guarantees or timelines you did not supply.
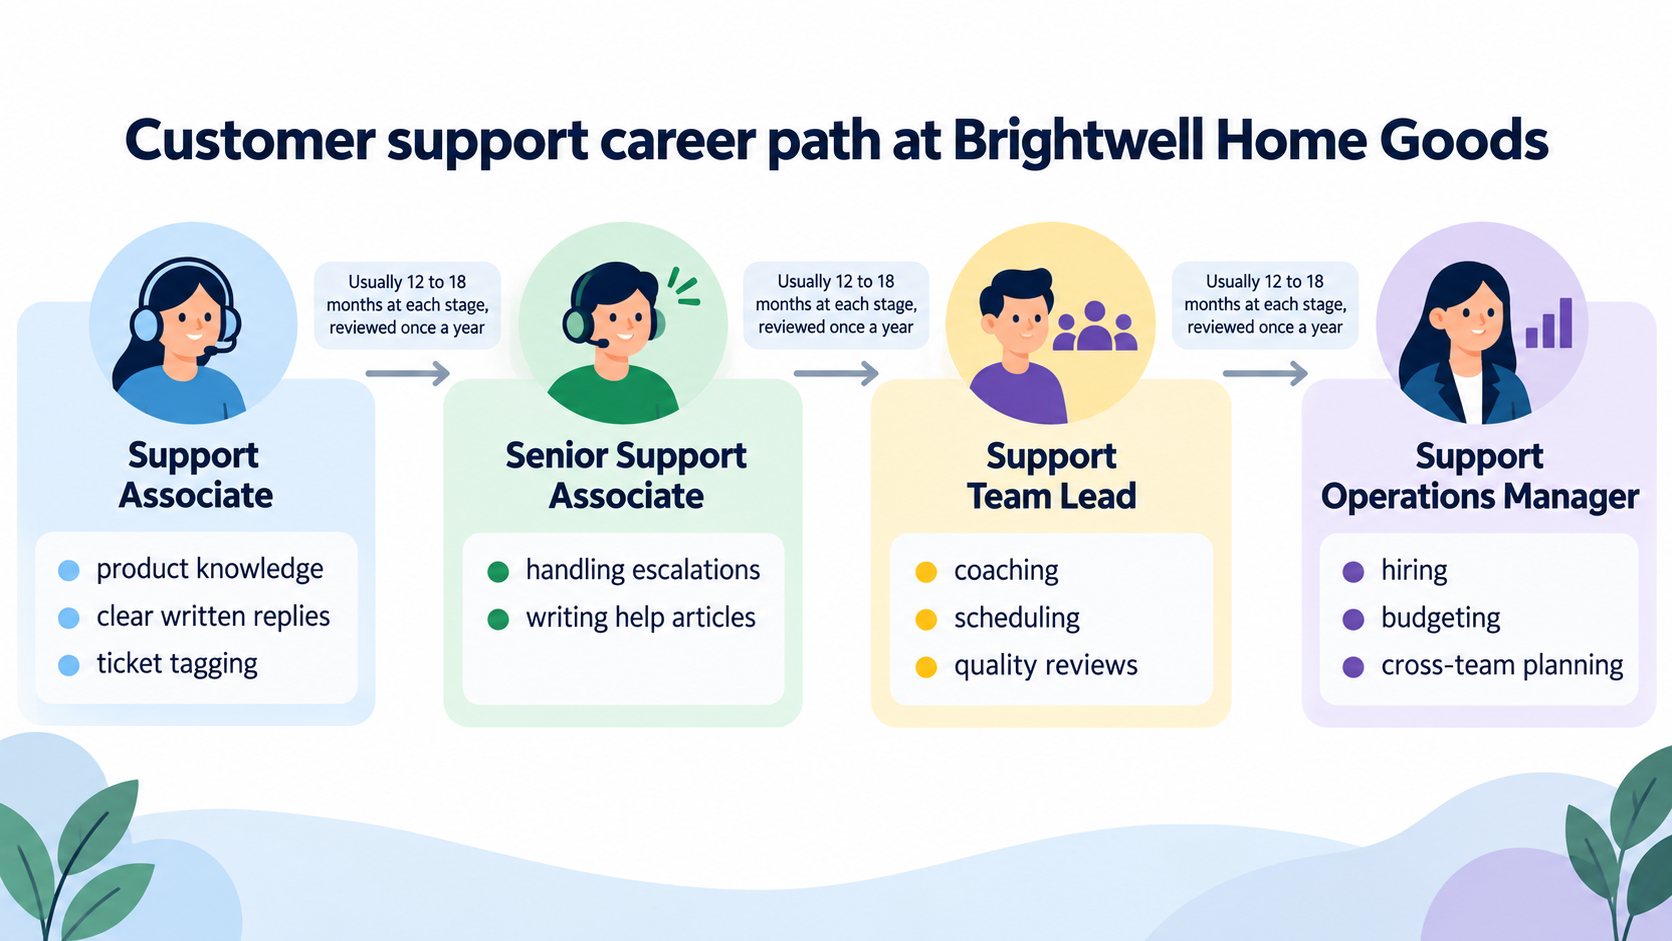
Four-stage support career path with skills and timing
Path title
Customer support career path at Brightwell Home Goods
Stages in order, one per line
Support Associate
Senior Support Associate
Support Team Lead
Support Operations Manager
Skills for each stage
Support Associate: product knowledge, clear written replies, ticket tagging
Senior Support Associate: handling escalations, writing help articles
Support Team Lead: coaching, scheduling, quality reviews
Support Operations Manager: hiring, budgeting, cross-team planning
Typical time at each stage (optional)
Usually 12 to 18 months at each stage, reviewed once a year
Five stages ending in a two-way branch, long titles and no timing
Path title
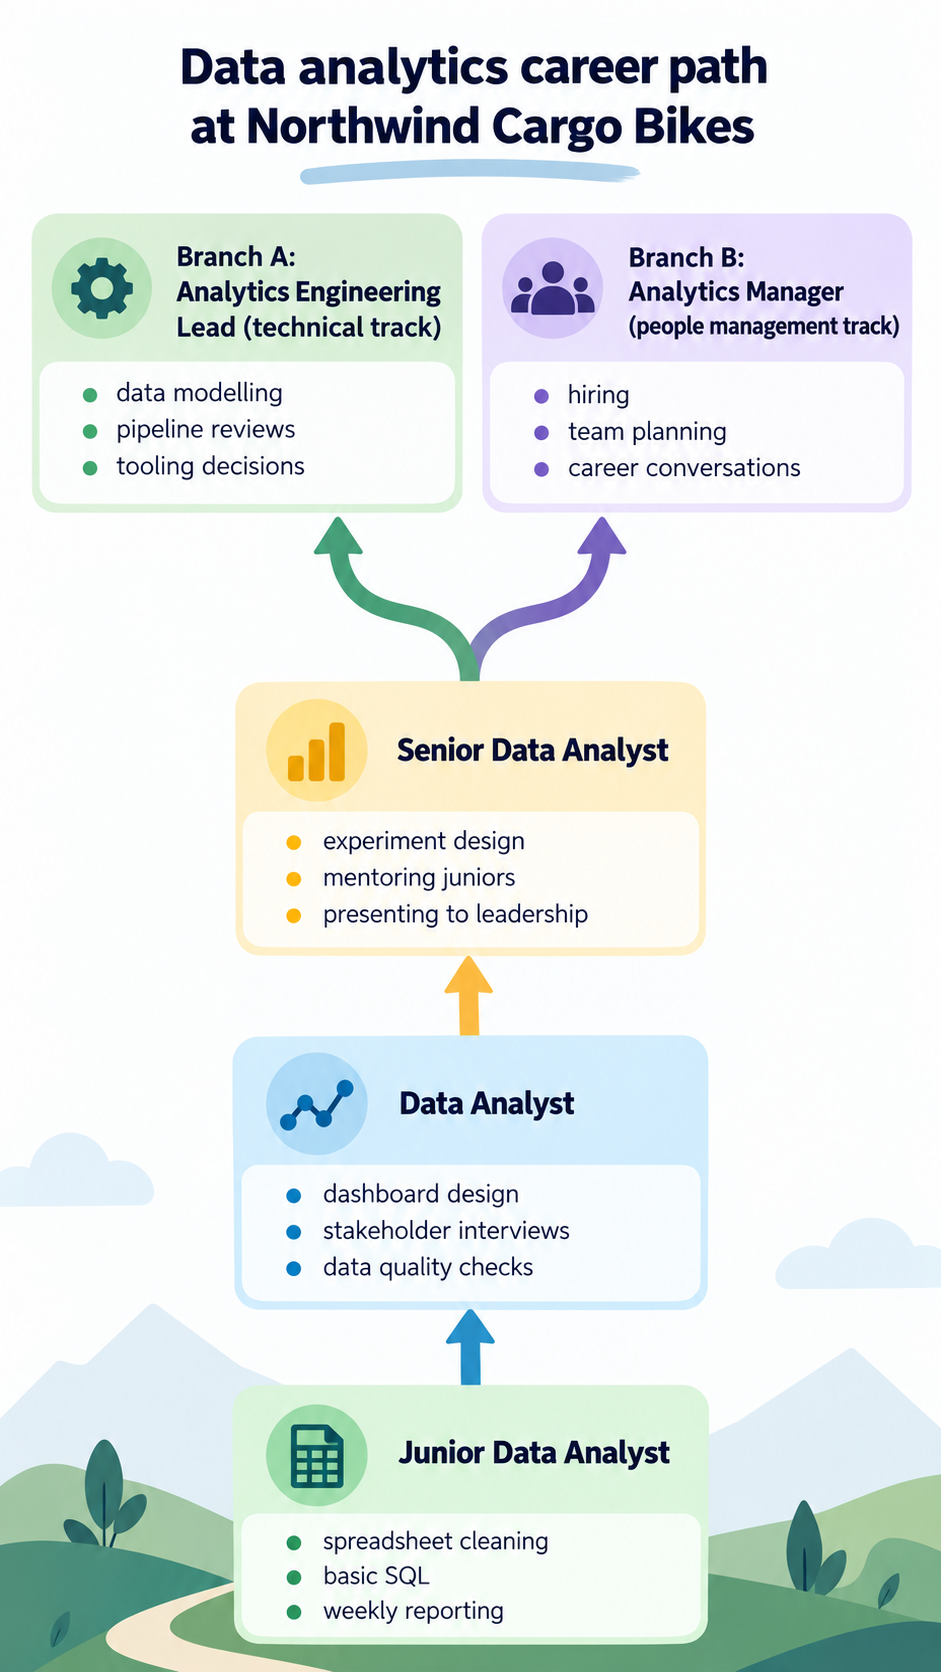
Data analytics career path at Northwind Cargo Bikes
Stages in order, one per line
Junior Data Analyst
Data Analyst
Senior Data Analyst
Branch A: Analytics Engineering Lead (technical track)
Branch B: Analytics Manager (people management track)
Skills for each stage
Junior Data Analyst: spreadsheet cleaning, basic SQL, weekly reporting
Data Analyst: dashboard design, stakeholder interviews, data quality checks
Senior Data Analyst: experiment design, mentoring juniors, presenting to leadership
Branch A: Analytics Engineering Lead (technical track): data modelling, pipeline reviews, tooling decisions
Branch B: Analytics Manager (people management track): hiring, team planning, career conversations
Typical time at each stage (optional)
Left empty
A path that splits into two named tracks, long stage titles and no timing. Checks the fork appears only where described, titles stay verbatim, and no durations or salaries are filled in.
Same task, three directions
Pick a direction to start from.
01
Rising steps
Stages climb from left to right like a staircase, with the skills written on each step.
02
Transit line
Each stage is a station on one colored line. Works well when the path branches into two tracks.
03
Portrait ladder
A tall layout for a careers page or a mentoring handout, first stage at the bottom.
What the template keeps
The parts that stay consistent.
01
Stage order
Stages always run in the sequence you give, so the path reads as progression.
02
Skills beside their stage
Each skill list stays attached to its node instead of floating in a separate legend.
03
No promises
The graphic shows a route, not an outcome, so nothing suggests a guaranteed promotion or pay.
How to use it
From details to a result.
01
Name the path
Give the role family or team a title. It becomes the heading of the image.
02
List the stages in order
One stage per line, starting with the entry point. Describe a branch in the stage name if the path splits.
03
Add skills for each stage
Start each line with the stage title, then two to four skills. That is how skills are matched to the right node.
04
Review, generate and compare
Send the brief from Vizify when it looks right, then check each title and skill against your list before sharing.
Output boundaries
What to check before you use it.
Stage titles and skills are drawn as text inside the image and can come back misspelled or out of order. Check each against your list.
Three to six stages fit on one image. A full competency framework needs several images or a document.
It shows the path you describe, not a forecast. No salaries, guarantees or success rates are added.
Branches appear only where you describe them. A detailed org-wide job architecture is better as a structured diagram.
The result is one flat image, not an editable diagram, and the format is an aspect-ratio direction.
QuestionsCan a career infographic show two possible routes?+
Yes. Name the branches in your stage list, for example a technical track and a management track, and the fork is drawn only at that point.
Can I include pay bands or salaries?+
Only if you type them yourself in the additional direction, exactly as your HR team has approved them. The template never estimates or suggests pay.
What makes good career infographic examples for a team wiki?+
Short stage titles, two to four concrete skills per stage and an honest note that timing varies. Readers skim, so fewer words per stage work better.
Can students use it to explore careers?+
Yes, if they take the stages from a careers adviser or a source they trust. The template does not research entry requirements or qualifications.