Lay out the design thinking stages in your own words, with a short explanation and an optional worked case for each, as one teaching infographic or poster.
One generated image showing the stages you name in order, each with your one-line explanation and optional case note, plus arrows showing where teams loop back. Check each stage name and sentence before printing or sharing.
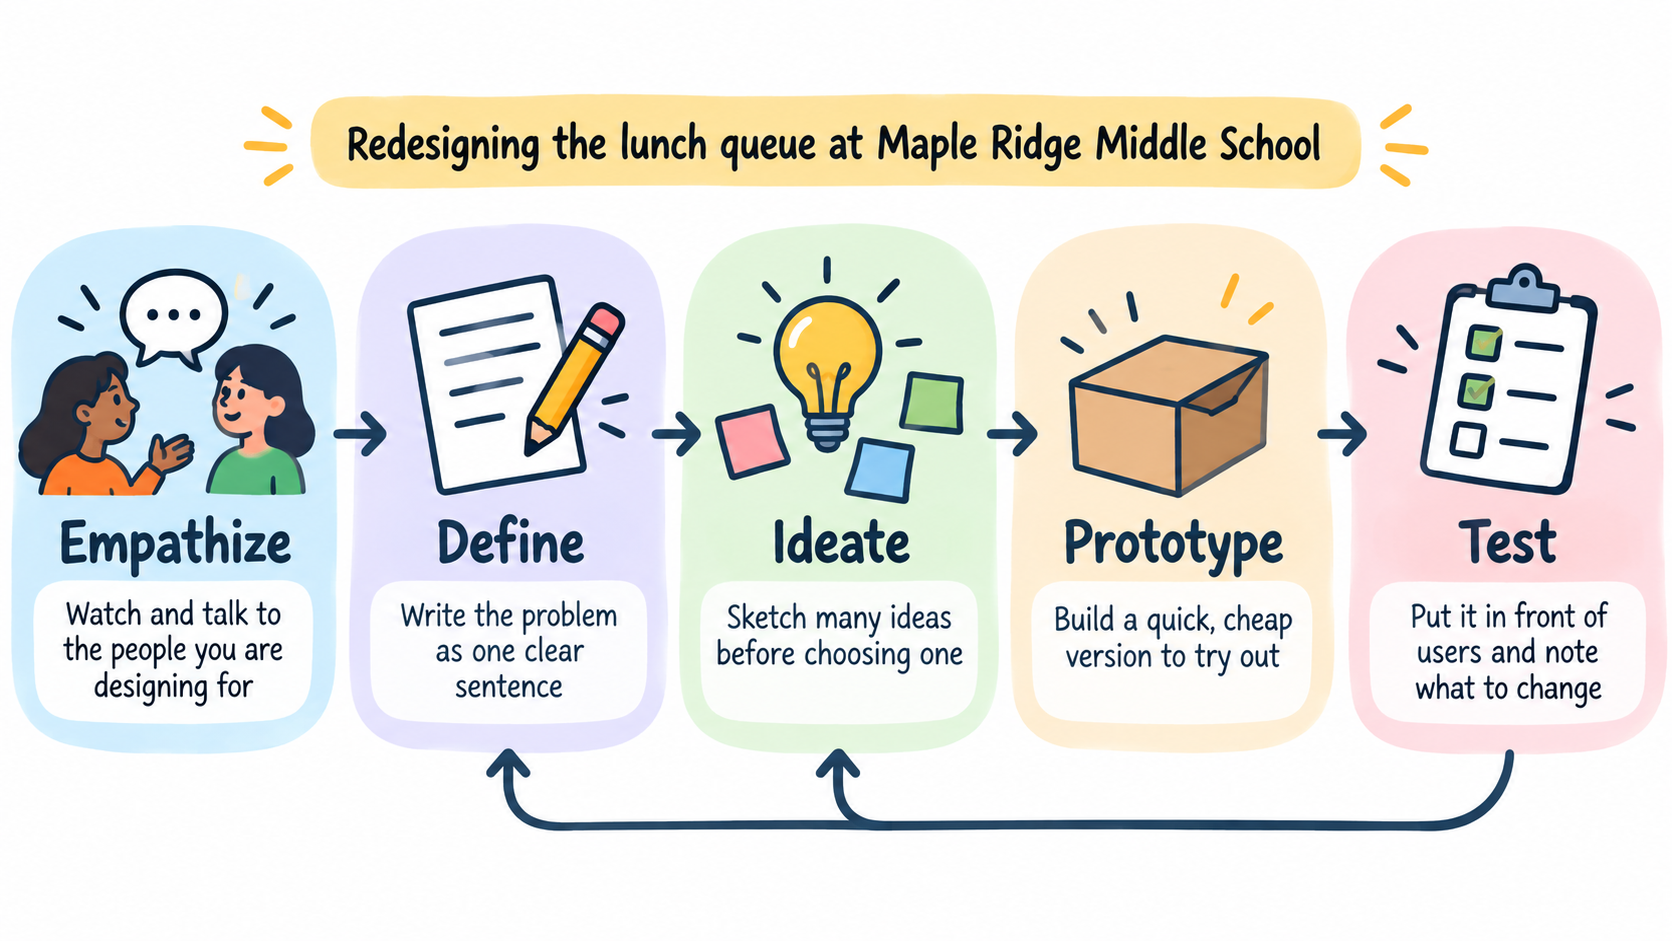
Five classic stages with a school lunch-queue case
Stages in order, one per line
Empathize
Define
Ideate
Prototype
Test
One-line explanation for each stage
Empathize: Watch and talk to the people you are designing for
Define: Write the problem as one clear sentence
Ideate: Sketch many ideas before choosing one
Prototype: Build a quick, cheap version to try out
Test: Put it in front of users and note what to change
Worked case (optional)
Redesigning the lunch queue at Maple Ridge Middle School
Where teams loop back (optional)
From Test back to Define or Ideate when users struggle with the prototype
Six custom stage names, two loop-backs and no case
Stages in order, one per line
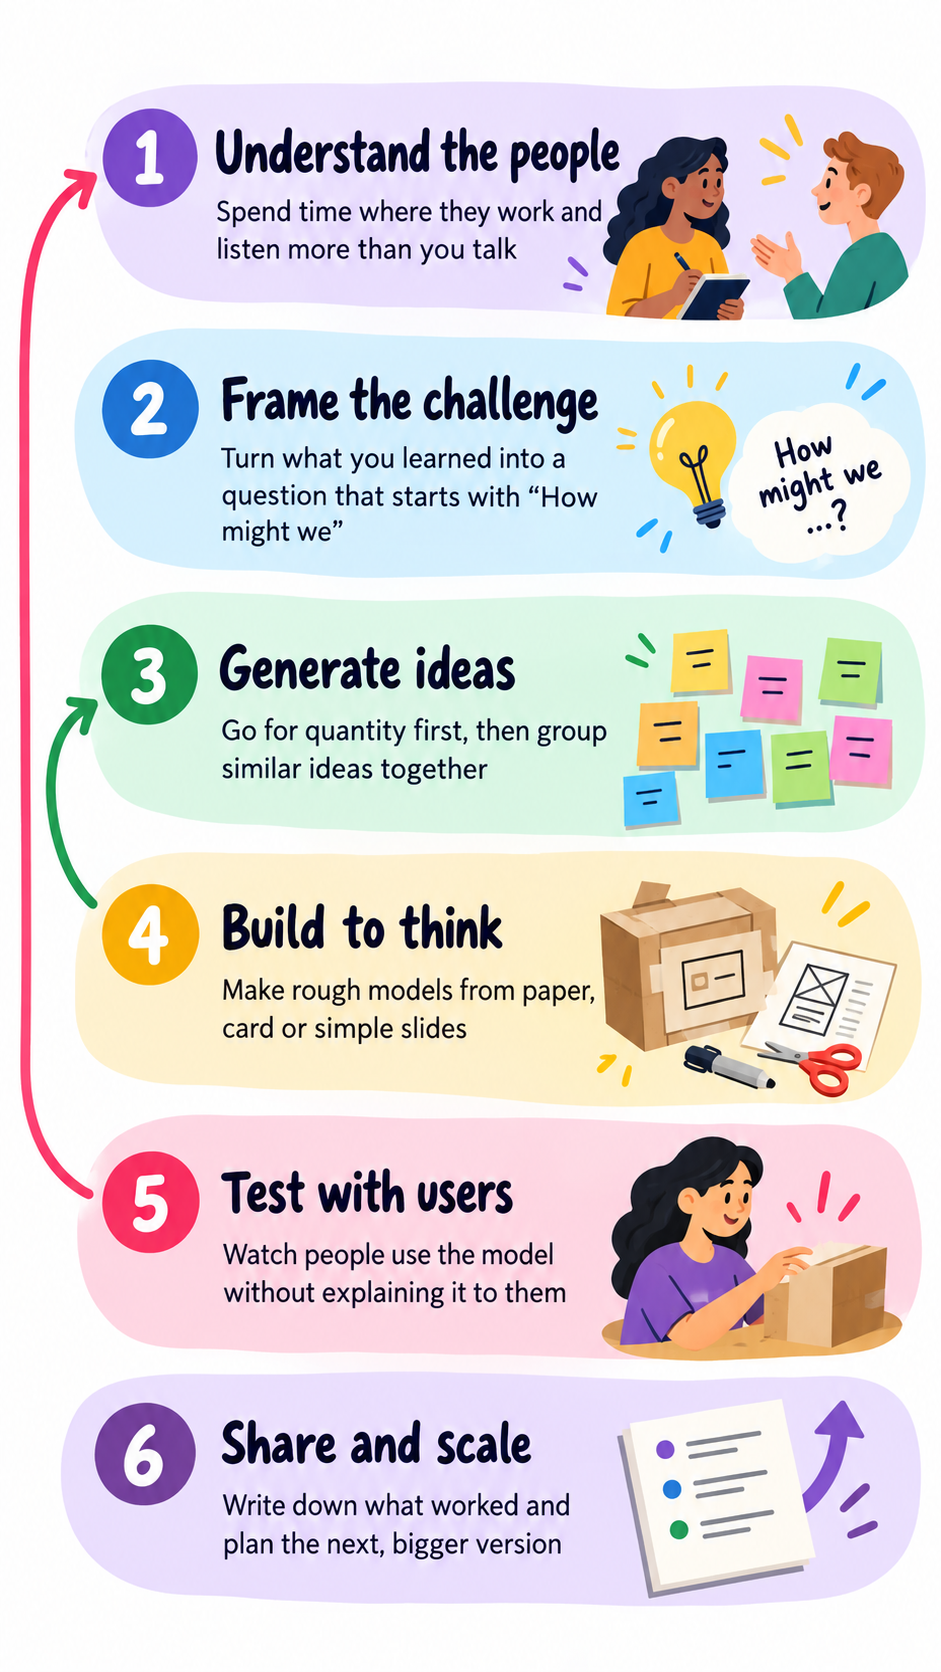
Understand the people
Frame the challenge
Generate ideas
Build to think
Test with users
Share and scale
One-line explanation for each stage
Understand the people: Spend time where they work and listen more than you talk
Frame the challenge: Turn what you learned into a question that starts with "How might we"
Generate ideas: Go for quantity first, then group similar ideas together
Build to think: Make rough models from paper, card or simple slides
Test with users: Watch people use the model without explaining it to them
Share and scale: Write down what worked and plan the next, bigger version
Worked case (optional)
Left empty
Where teams loop back (optional)
From Test with users back to Understand the people, and from Build to think back to Generate ideas
Six custom stage names with long explanations, two separate loop-backs and no case. Checks stage names stay verbatim, both return arrows point where described, and no case study is invented.
Same task, three directions
Pick a direction to start from.
01
Loop around a circle
Stages sit around a circle to stress that the process repeats, with loop-backs drawn inside.
02
Classroom wall poster
A tall layout with big stage names and simple icons that can be read from across a room.
03
Workshop opening slide
A wide flow for a facilitator's first slide, with curved arrows showing where the group may return.
What the template keeps
The parts that stay consistent.
01
Stage order
Stages always appear in the order you list, however many you use.
02
Visible iteration
Return arrows make clear that the process loops rather than ending at the last stage.
03
An original layout
Shapes and colors are drawn fresh rather than copied from a well-known published diagram.
How to use it
From details to a result.
01
Name your stages
Use the stage names your course or team already teaches, one per line and in order.
02
Explain each stage in one line
Start each line with the stage name, then a short plain-language explanation.
03
Add a case and the loop-backs
Optionally name a worked case and say where teams return to an earlier stage.
04
Review, generate and check
Your stages wait in Vizify until you choose to send them. Read each stage and explanation on the result against your course notes.
Output boundaries
What to check before you use it.
Stage names and explanations are drawn by the image model. Check spelling and that each explanation sits under the right stage.
Up to six stages with one sentence each fit on one image. Method cards or detailed activities need several images or a handout.
The layout will not reproduce a specific published design thinking diagram, its shapes or its branding.
It adds no definitions, attributions or case results beyond what you supply.
This is a picture, not an editable diagram. For a process chart you can change later, a structured flowchart is the better choice.
QuestionsCan I print this as a design thinking poster?+
You get one generated image at the model's resolution, not a print file. For a classroom wall choose the portrait format and check that the text is sharp at the size you plan to print.
Do I have to use five stages?+
No. Use the stages your course teaches, whether that is three, five or six. The template keeps your count and your names.
Can I credit the model my course is based on?+
Yes. Add the credit line in the additional direction, for example "Adapted from our course handbook". The template never adds an attribution by itself.
Can students use a design thinking infographic to document a project?+
Yes. Put the project in the worked case field, such as redesigning the lunch queue, and keep each explanation to one short line.