One generated image showing the steps of the scientific method exactly as you word them, connected in order, with an optional example line beside each step. Check every step and example against your lesson before sharing.
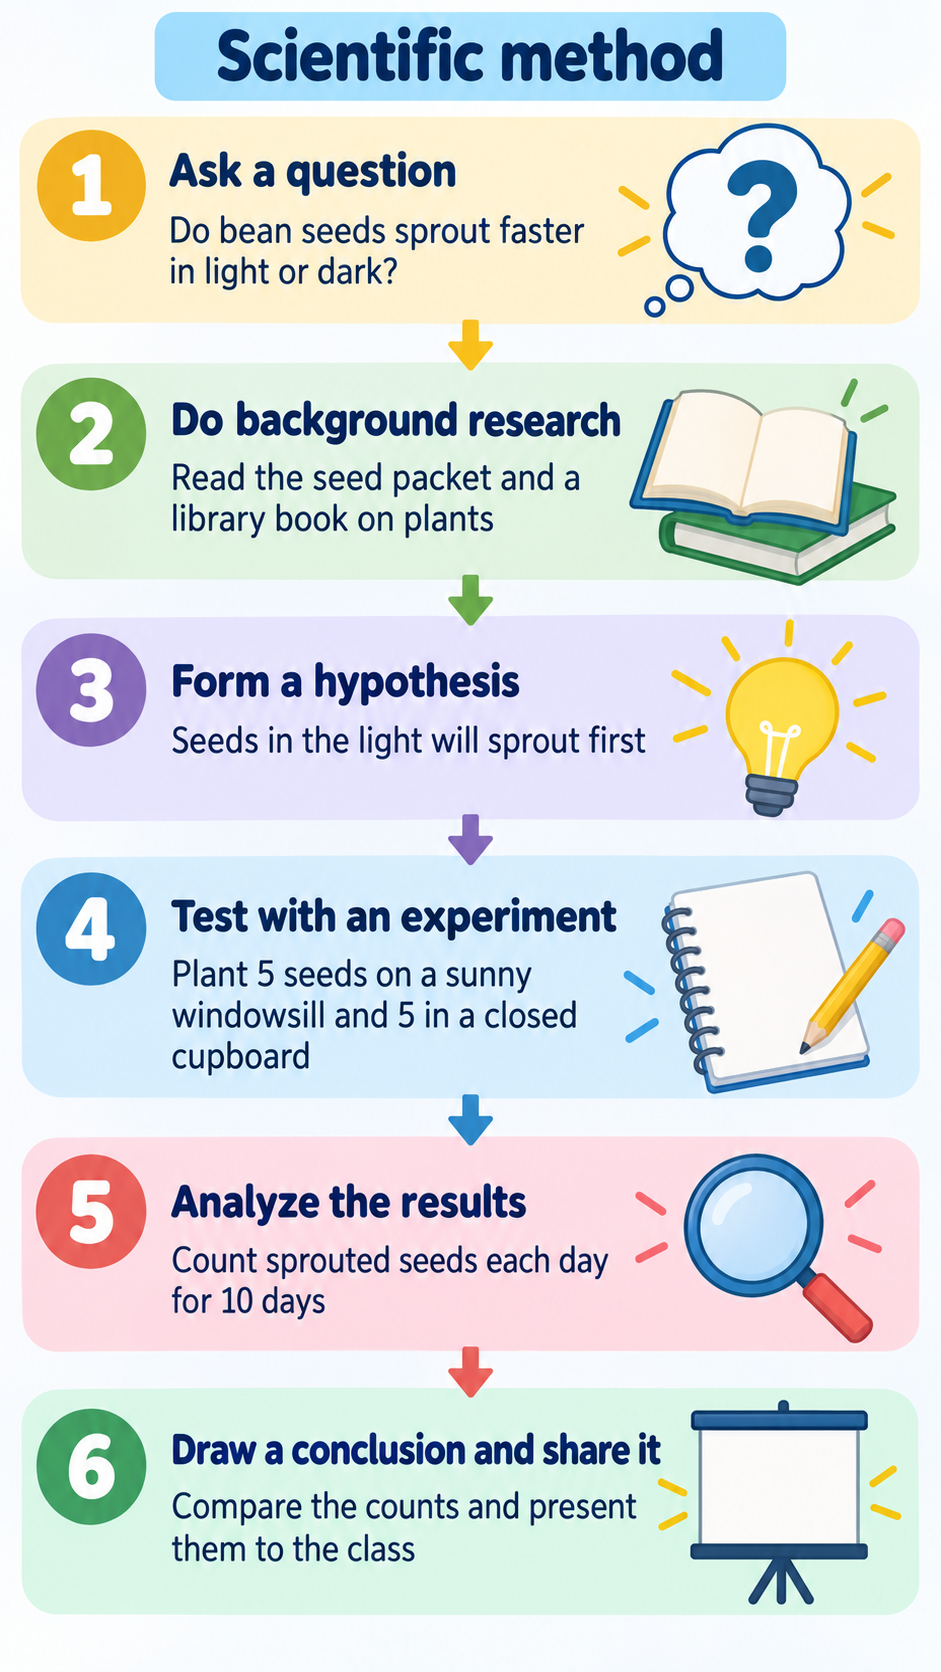
Six steps for Grade 5 with a bean sprouting example
Steps in your approved wording, one per line
Ask a question
Do background research
Form a hypothesis
Test with an experiment
Analyze the results
Draw a conclusion and share it
Grade or age group
Grade 5 (ages 10 to 11)
Worked example for each step (optional)
Ask a question: Do bean seeds sprout faster in light or dark?
Do background research: Read the seed packet and a library book on plants
Form a hypothesis: Seeds in the light will sprout first
Test with an experiment: Plant 5 seeds on a sunny windowsill and 5 in a closed cupboard
Analyze the results: Count sprouted seeds each day for 10 days
Draw a conclusion and share it: Compare the counts and present them to the class
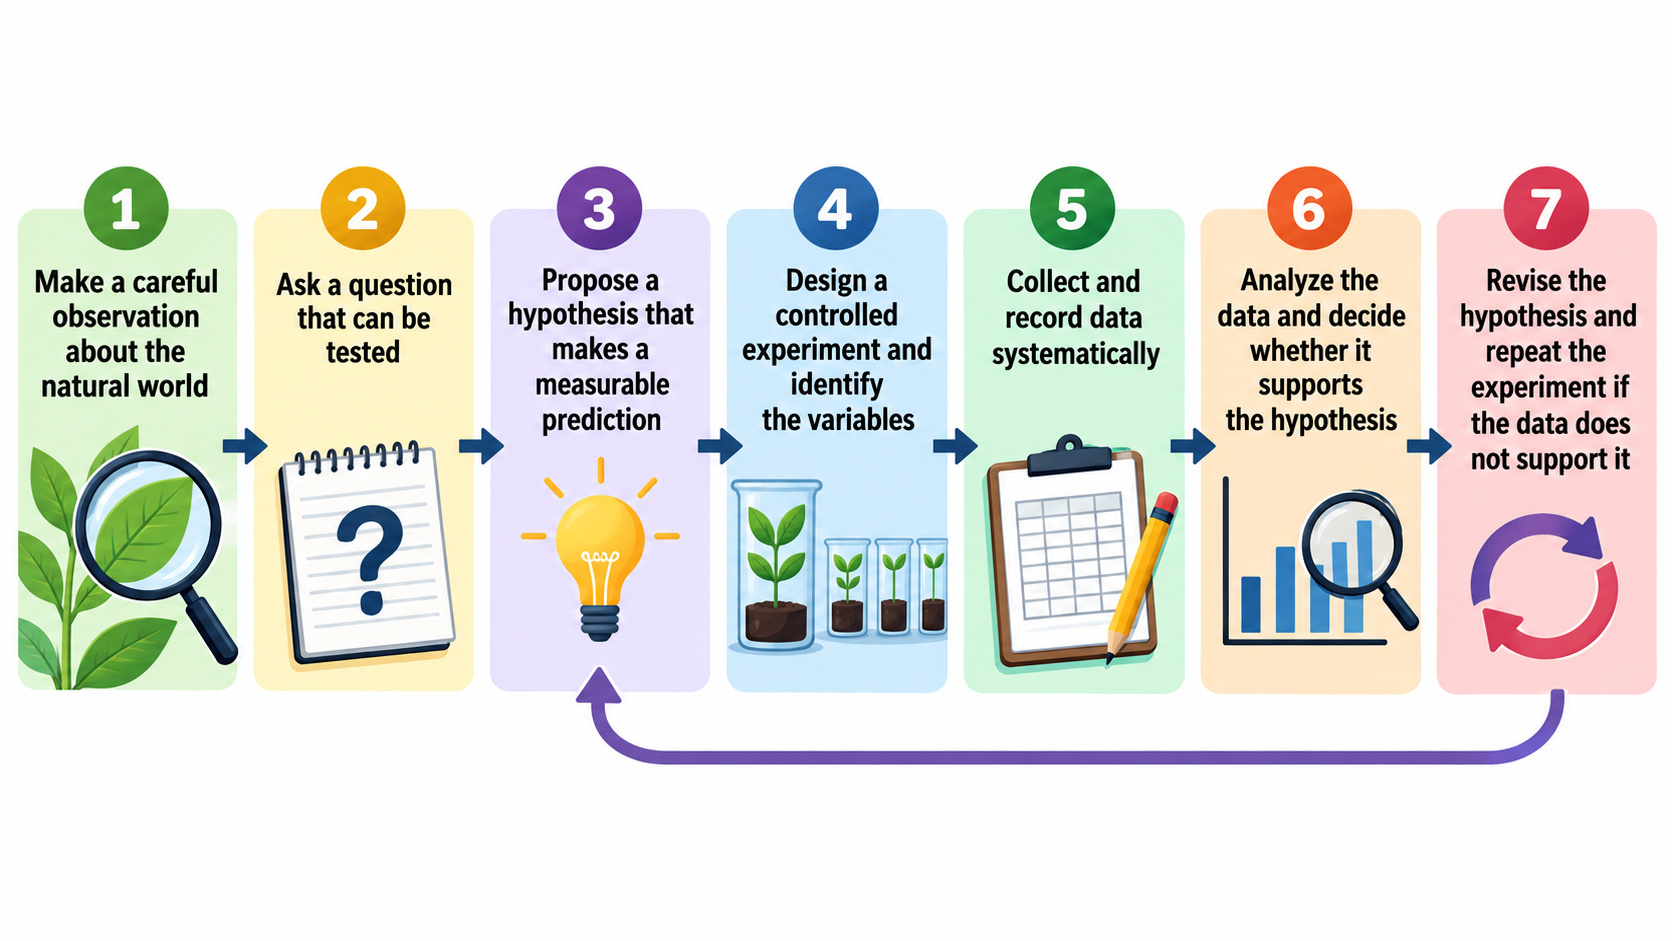
Seven long steps for high school with a revise loop and no example
Steps in your approved wording, one per line
Make a careful observation about the natural world
Ask a question that can be tested
Propose a hypothesis that makes a measurable prediction
Design a controlled experiment and identify the variables
Collect and record data systematically
Analyze the data and decide whether it supports the hypothesis
Revise the hypothesis and repeat the experiment if the data does not support it
Grade or age group
High school biology (ages 15 to 16)
Worked example for each step (optional)
Left empty
Seven long steps for older students, a final step that describes revising and repeating, and no worked example. Checks every step keeps its exact wording, the loop back appears because the steps describe it, and no sample experiment is invented.
Same task, three directions
Pick a direction to start from.
01
Steps on an open arc
Arrange the supplied steps around an open arc. A return arrow appears only when your instructions name one.
02
Lab notebook page
Looks like a neat notebook page, with numbered step headings and the example written beneath each.
03
Steps with an example column
Steps flow down the left while the worked example runs alongside on the right, step by step.
What the template keeps
The parts that stay consistent.
01
Your wording
Steps appear exactly as your class learns them, not as a generic textbook list.
02
Clear sequence
Arrows make the order obvious, with a loop only where your steps describe one.
03
Safe, generic illustrations
Icons support the steps without showing unsafe lab practice.
How to use it
From details to a result.
01
Enter your approved steps
Use the exact wording your curriculum or lesson uses, one step per line and in order.
02
Set the grade or age group
This changes the type size and illustration style, not your wording.
03
Add a worked example
Optional. Start each line with the step name so it sits next to the right step.
04
Review, generate and check
Check the brief in Vizify, then press Send. Read each step and example on the result against your lesson plan.
Output boundaries
What to check before you use it.
Step wording and example text are image text, and small errors can slip in. Read every line against your lesson plan.
Four to seven short steps fit on one image. A full lab write-up or a rubric belongs in a worksheet.
The template teaches the wording you supply and adds no experiment results, data or scientific claims.
Illustrations are generic and do not show real lab procedures or safety instructions. Teach safety rules separately.
Results from your class experiment belong in a chart built from the numbers, using one of Vizify's chart tools.
The selected ratio guides composition. Check the actual image dimensions and print readability; no exact pixels, PDF, bleed, layers or editable chart are promised.
QuestionsMy textbook uses different step names. Which ones does the image use?+
The brief asks for your supplied step names and wording, whether you use four, five or seven steps. Generated lettering can still contain errors, so compare every line with your lesson before sharing.
Can I make a scientific method visual for younger students?+
Yes. Set the grade to something like Grade 2 and keep the steps short. The style becomes friendlier while your wording stays the same.
Can I include my class's experiment data?+
Put the data in a chart built from your numbers, where each value is plotted exactly. This image can describe the experiment, but it should not carry the results.
Can I print it for the classroom wall?+
You get one generated image, not a print file. The portrait format suits a wall, and it is worth checking the text is sharp at your print size.