Customer journey map with stages, actions and satisfaction scores.
Map how one customer moves through your stages, what they do at each step, who is involved and how each moment scored. Built from your own research or estimates.
One journey diagram with your stages as sections, each action as a task with its 1-5 score and the people involved. Only your actions and scores are used. Check that every action sits in the right stage and every score matches your notes.
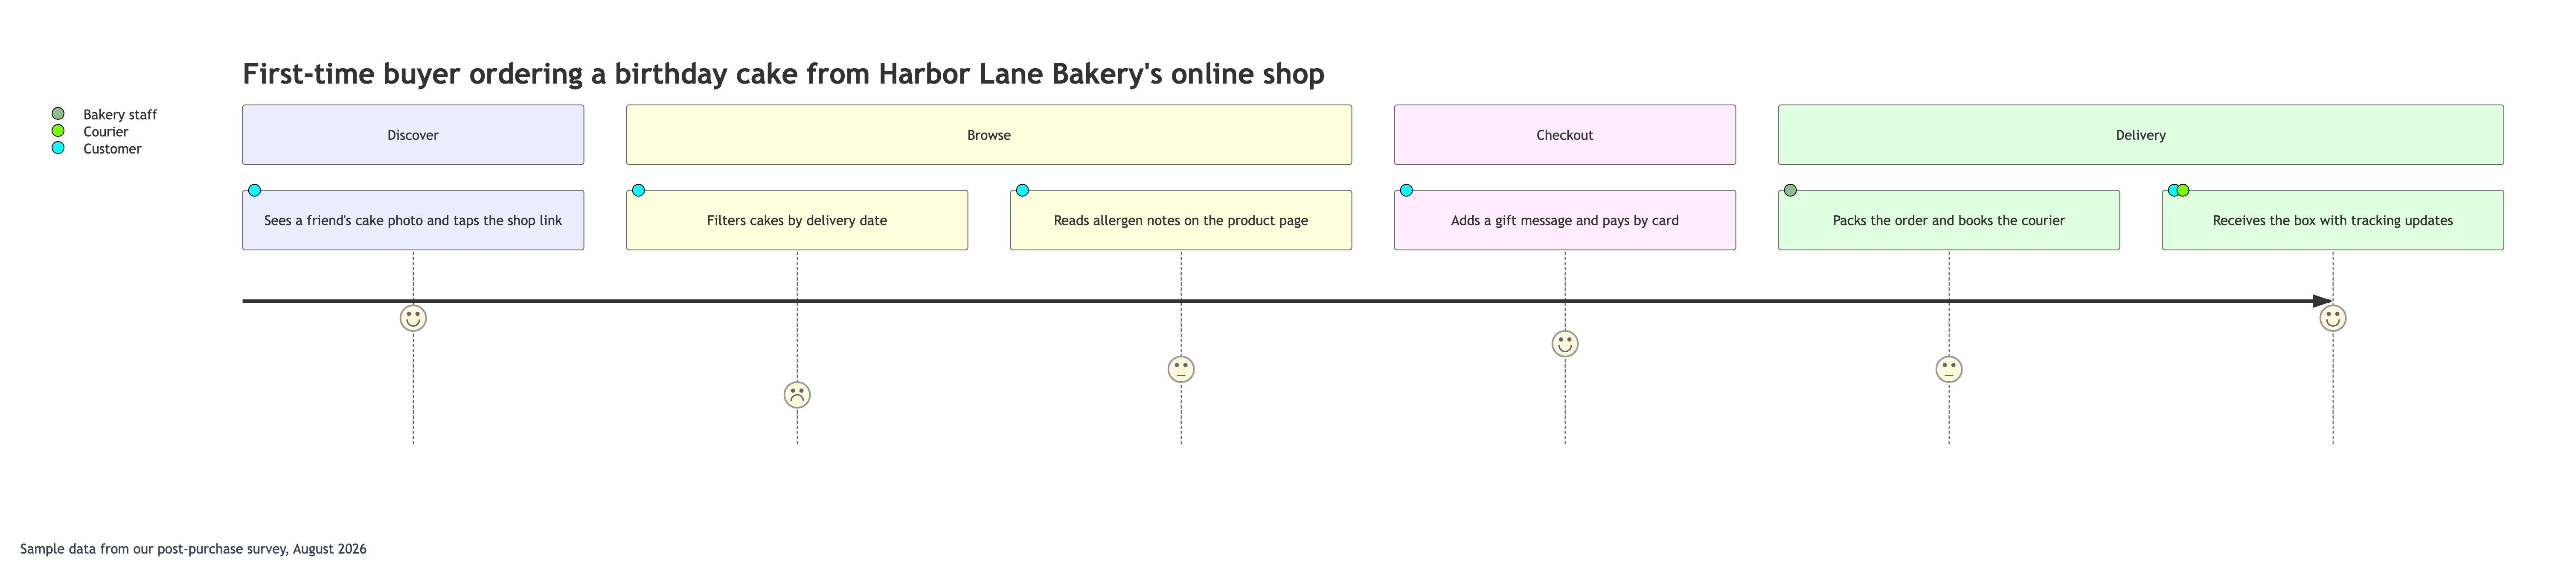
First-time buyer ordering a birthday cake from Harbor Lane Bakery's online shop
Steps as stage | action | score 1-5 | who
Discover | Sees a friend's cake photo and taps the shop link | 5 | Customer
Browse | Filters cakes by delivery date | 2 | Customer
Browse | Reads allergen notes on the product page | 3 | Customer
Checkout | Adds a gift message and pays by card | 4 | Customer
Delivery | Packs the order and books the courier | 3 | Bakery staff
Delivery | Receives the box with tracking updates | 5 | Customer, Courier
Where the scores come from
Sample data from our post-purchase survey, August 2026
B2B license renewal with long actions and two roles on one step
Whose journey, and what they are trying to do
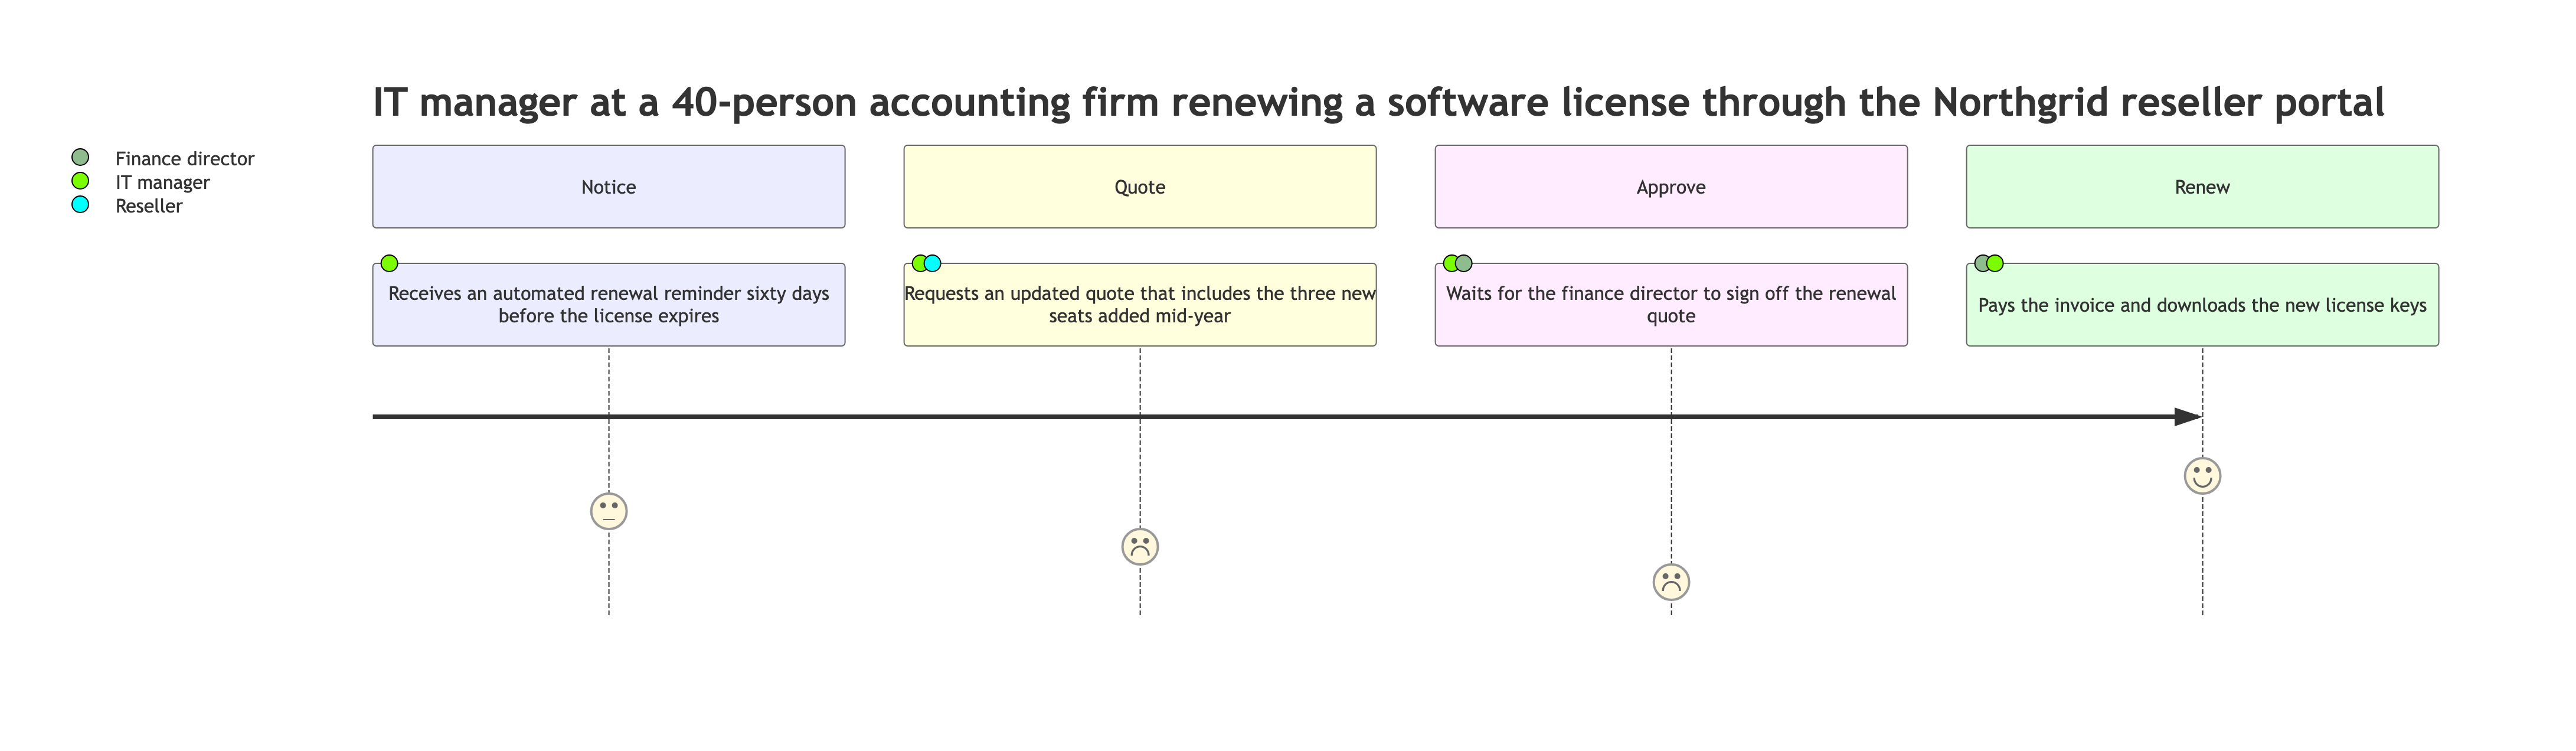
IT manager at a 40-person accounting firm renewing a software license through the Northgrid reseller portal
Steps as stage | action | score 1-5 | who
Notice | Receives an automated renewal reminder sixty days before the license expires | 3 | IT manager
Quote | Requests an updated quote that includes the three new seats added mid-year | 2 | IT manager, Reseller
Approve | Waits for the finance director to sign off the renewal quote | 1 | IT manager, Finance director
Renew | Pays the invoice and downloads the new license keys | 4 | Finance director, IT manager
Where the scores come from
Left empty
Uses a low but explicit score for the approval wait. Checks that long actions wrap without being cut and that two people on one step both appear.
Same task, three directions
Pick a direction to start from.
01
Ecommerce purchase journey
A shopper's path from discovery to delivery, with the steps your team handles shown alongside the customer's own.
02
B2B buying journey with several roles
Buyers, approvers and your own team as separate people on the diagram, for longer sales where more than one person decides.
03
Planned future-state journey
The journey you intend to create, with target scores, for a customer journey presentation next to the current map.
What the template keeps
The parts that stay consistent.
01
Your stages, in order
Sections follow the order you wrote them, so the map reads the way the customer moves.
02
Scores you gave
Each 1-5 score is shown as supplied. No averages or extra ratings are added.
03
Everyone involved
Every person named on a step appears on that step, including your own staff.
How to use it
From details to a result.
01
Name the customer and their goal
One customer type and one task per map. The goal becomes the diagram title.
02
Write one line per action
Give the stage, the action, a score from 1 to 5 and who takes part, separated by vertical bars.
03
Say where the scores come from
A survey, interviews or your team's estimate. The reply repeats it so the map is not mistaken for research it is not.
04
Review in Vizify, then check the map
Nothing runs until you send the brief. After it renders, check each action's stage, score and people.
Output boundaries
What to check before you use it.
Scores are whole numbers from 1 to 5. Convert other scales yourself or state the rule you want used.
The diagram shows stages, actions, people and scores. Channel rows, customer quotes and opportunity notes found in slide-style maps are not part of this diagram type.
Vizify does not run customer research or supply satisfaction data. The map is as reliable as the scores you enter.
Layout and colors are automatic, and long actions wrap. Export options are whatever the Vizify App offers.
QuestionsCan I use this as an ecommerce customer journey map?+
Yes. The example on this page is an online order. List the shopper's actions from discovery to delivery, add your team's steps if they matter, and score each one from your own data.
What if I have not measured satisfaction yet?+
Use your team's best estimate and say so in the evidence field. The reply will describe the scores as estimates, which keeps the map honest when it is shared.
Can I put the map in a customer journey presentation?+
The map is a diagram artifact in Vizify. Export options depend on what the App offers for it; no slide file is produced by this template.
How is this different from a flowchart?+
A journey map follows one customer through time and scores how each step felt. A flowchart shows decisions and branches. If your process splits into different paths, a flowchart template fits better.
Can one journey mapping template cover two customer types?+
Map them separately. Put one customer type on each diagram so the scores stay comparable, then compare the two diagrams side by side.