One generated image with your topic as the title, a data section for your own figures and their source, and a separate tips section for your advice. It uses no live platform data. Check each number, platform name and handle before posting.
Bakery findings with three sourced figures and four tips
Topic
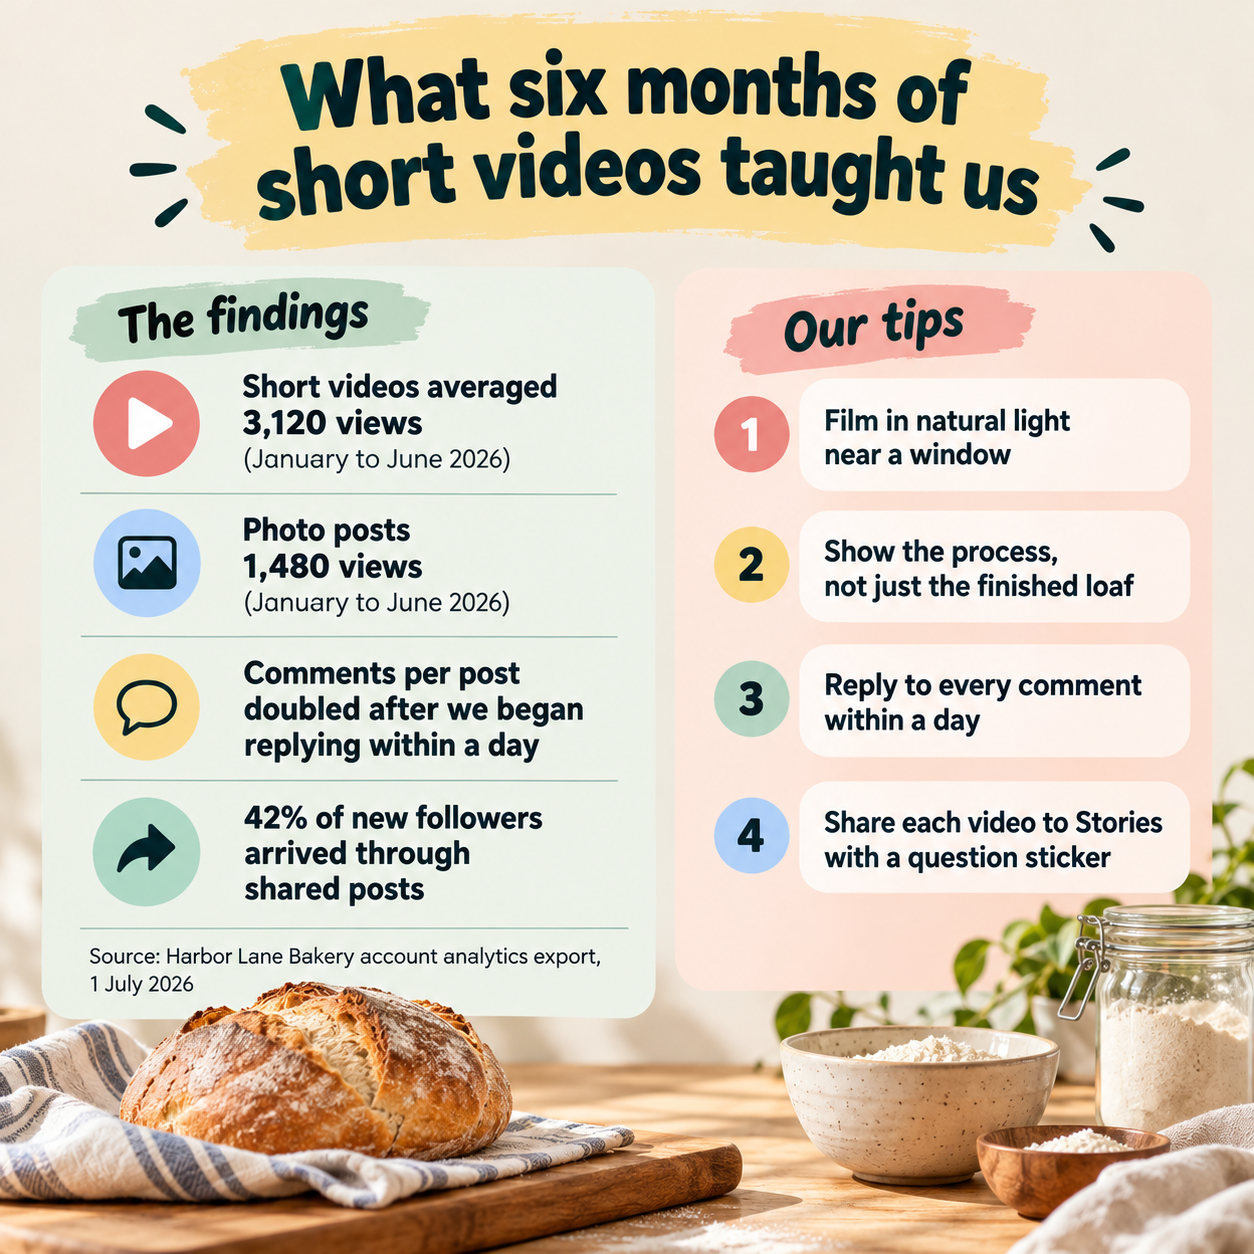
What six months of short videos taught us
Your figures and period (optional)
Short videos averaged 3,120 views, photo posts 1,480 (January to June 2026)
Comments per post doubled after we began replying within a day
42% of new followers arrived through shared posts
Source for your figures
Harbor Lane Bakery account analytics export, 1 July 2026
Your tips or recommendations, one per line
Film in natural light near a window
Show the process, not just the finished loaf
Reply to every comment within a day
Share each video to Stories with a question sticker
Tips only, with a long topic and no figures or source
Topic
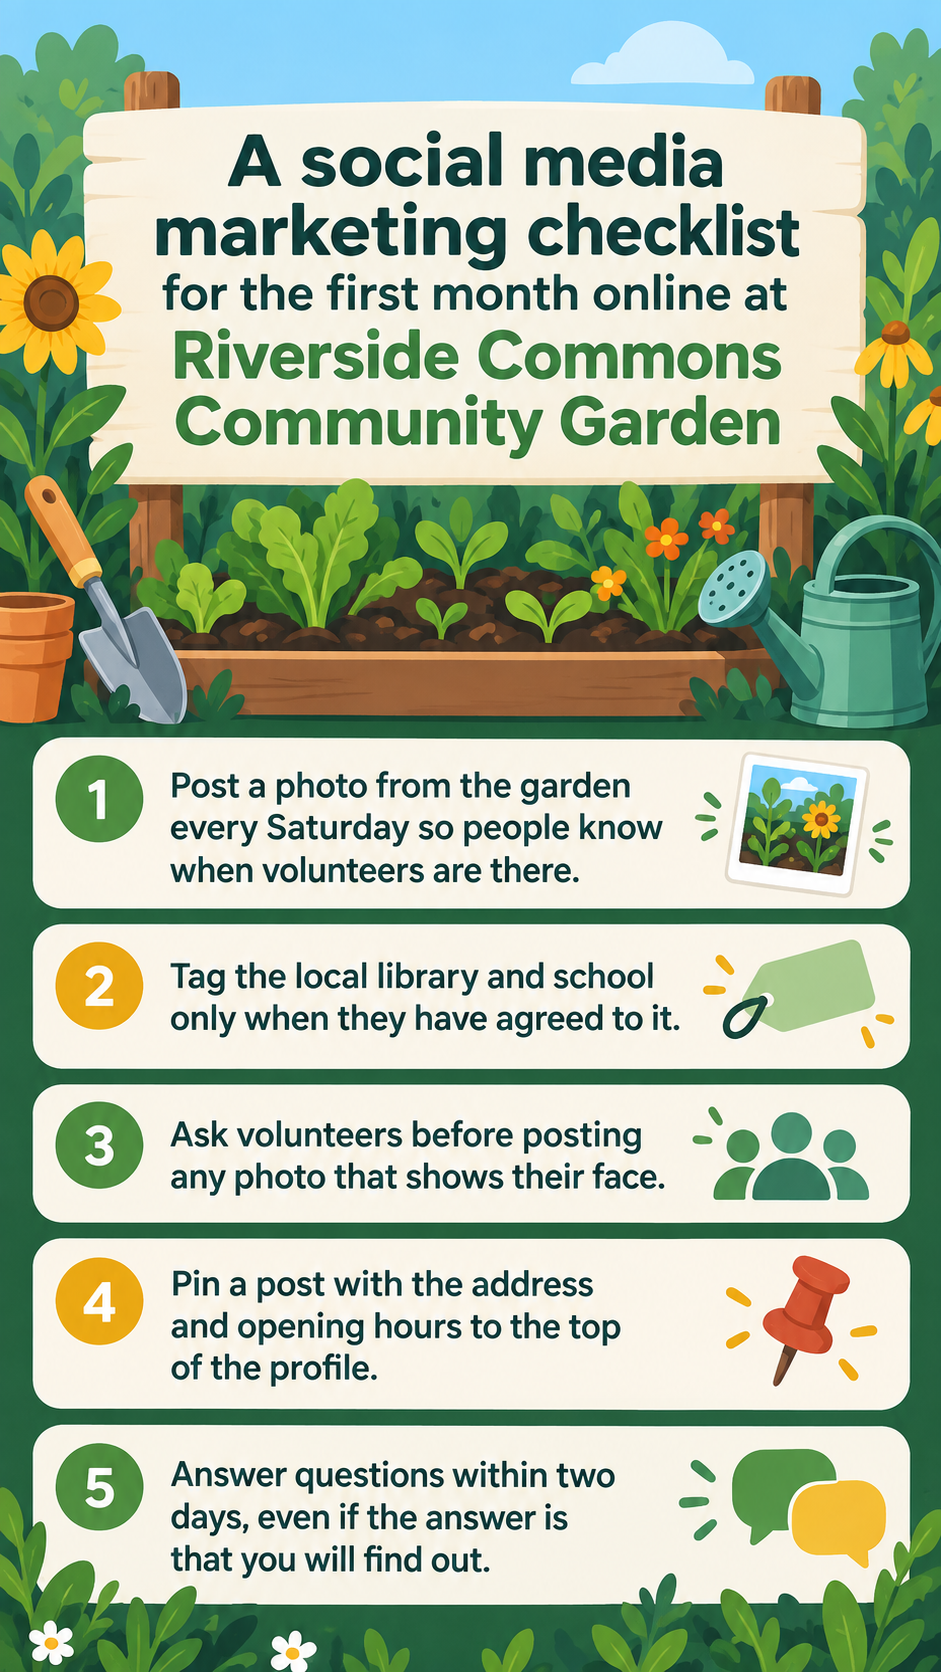
A social media marketing checklist for the first month online at Riverside Commons Community Garden
Your figures and period (optional)
Left empty
Source for your figures
Left empty
Your tips or recommendations, one per line
Post a photo from the garden every Saturday so people know when volunteers are there
Tag the local library and school only when they have agreed to it
Ask volunteers before posting any photo that shows their face
Pin a post with the address and opening hours to the top of the profile
Answer questions within two days, even if the answer is that you will find out
Audience (optional)
Volunteers with no marketing experience
No figures and no source, five long tips and a long topic. Checks the data zone is left out rather than filled with made-up statistics, the tips keep their exact wording, and no platform logos appear.
Same task, three directions
Pick a direction to start from.
01
Data over tips
A square split into a data panel with large numbers and a tips panel with check marks below it.
02
Tall story layout
The topic at the top, figures as big bubbles, then tips as numbered stickers, with key content away from the edges.
03
Editorial guide
A calm off-white layout with a thin rule between findings and advice, for a newsletter or blog header.
What the template keeps
The parts that stay consistent.
01
Data and advice apart
Figures and tips live in separate sections, so readers can tell what was measured from what is recommended.
02
Source under the figures
The source sits directly beneath the numbers it belongs to.
03
Generic social icons
Hearts, bubbles and arrows stand in for platform logos.
How to use it
From details to a result.
01
Name the topic
What the image is about, for example what you learned from a campaign or a set of tips for beginners.
02
Add your own figures and source
Optional. Copy up to four figures from your analytics and say where and when they were exported.
03
Write your tips
Up to five short, specific actions. They sit in their own section, apart from the data.
04
Review, generate and check
Generation starts only when you send the brief in Vizify. Check each figure, platform name and handle before posting.
Output boundaries
What to check before you use it.
Nothing is pulled from any platform. Figures must come from your own analytics or a source you can name.
Numbers, handles and platform names are image text. Check them against your export before posting.
Up to four figures and five tips fit. A full report or a month-by-month trend belongs in a chart built from your data.
Platform logos and interface screenshots are not reproduced; generic icons are used instead.
Each request makes one image. A carousel means one request per slide.
QuestionsCan this social media infographic template pull my latest analytics?+
No. It has no connection to any platform. Export your figures, paste the ones you want, and add the export date as the source.
Can I make an infographic about social media for a school assignment?+
Yes. Use figures from a source your teacher accepts and put that source in the source field, where it appears under the numbers.
Can a social media marketing infographic include industry benchmarks?+
Only benchmarks you can cite. Paste the figure and its source like any other data. The template never adds benchmark figures by itself.
Can I make a carousel?+
Each request makes one image. Create each slide as its own request and keep the style consistent by reusing the same direction.