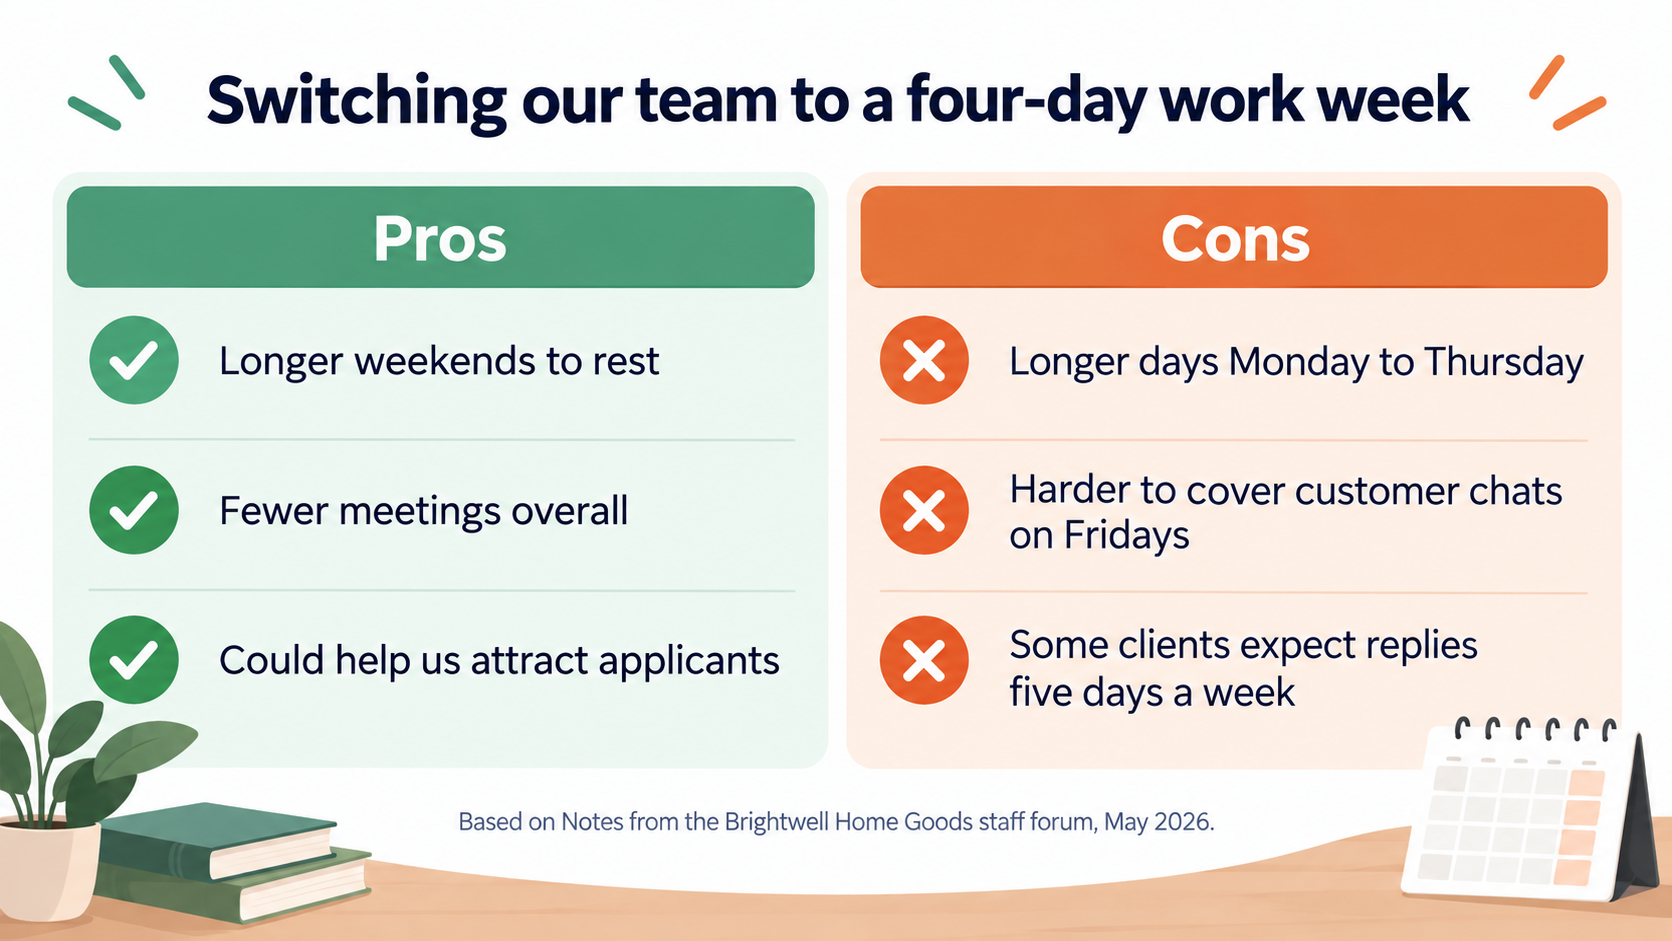
Weigh up one option with your own pros, cons and the basis for them, in a balanced two-column infographic for a class debate, a team decision or a guide.
One generated two-column image with the option or decision as the title, your pros on one side, your cons on the other, and an optional basis line. It adds no points and no verdict. Check the wording and that every point sits in the right column.
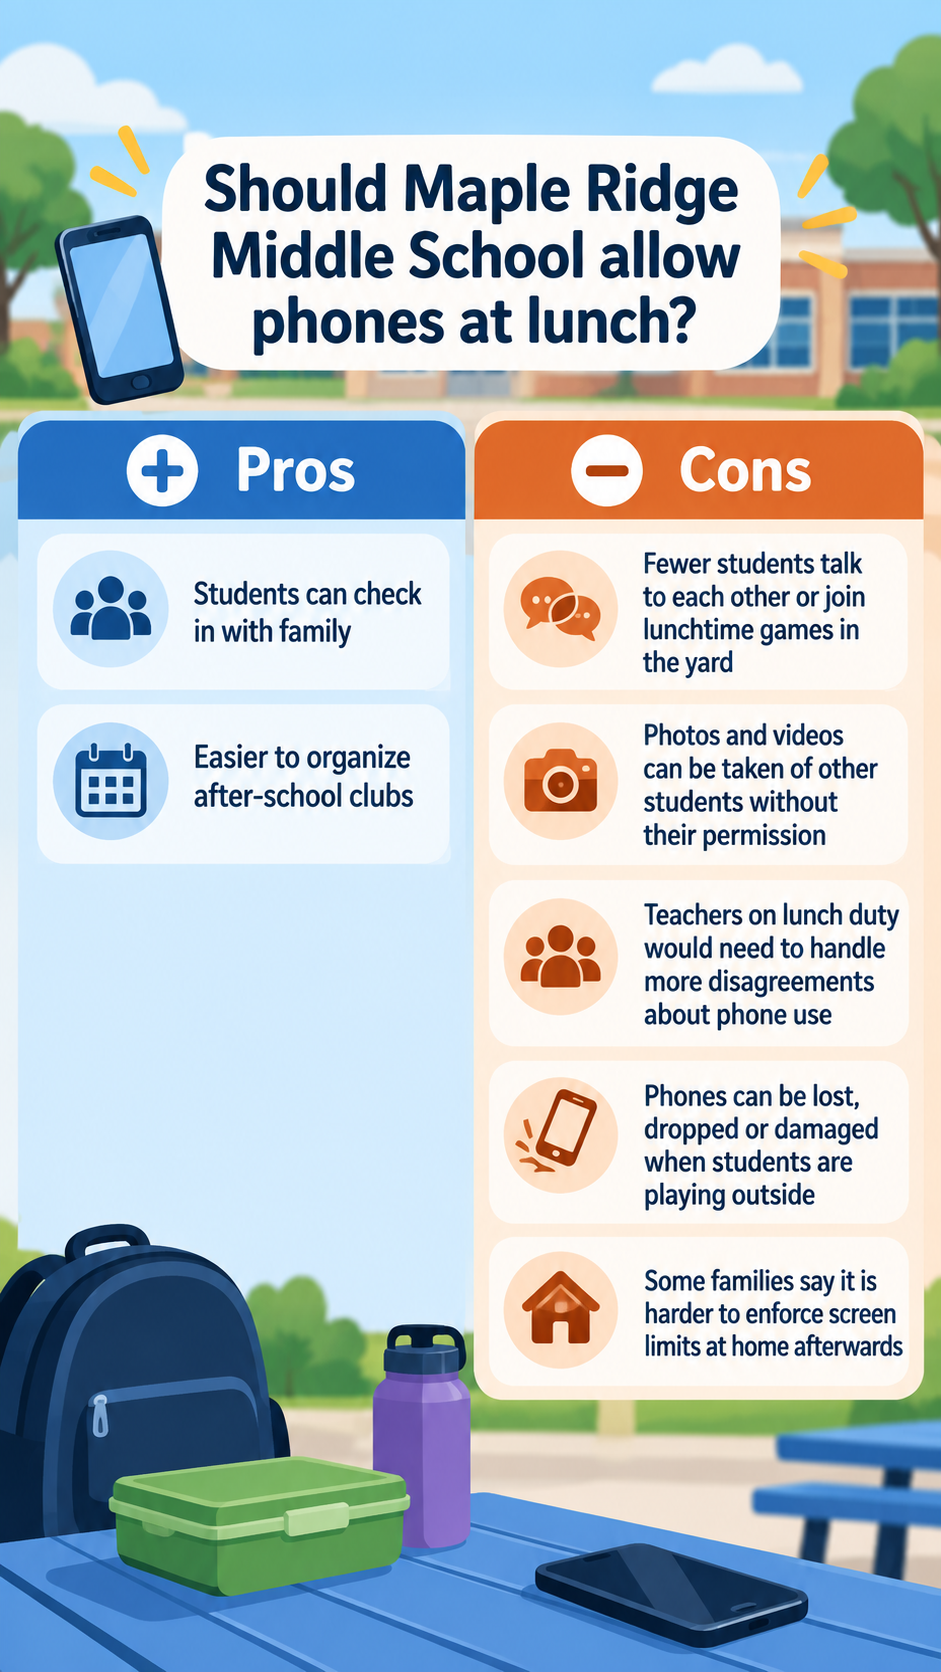
Should Maple Ridge Middle School allow phones at lunch?
Pros, one per line
Students can check in with family
Easier to organize after-school clubs
Cons, one per line
Fewer students talk to each other or join lunchtime games in the yard
Photos and videos can be taken of other students without their permission
Teachers on lunch duty would need to handle more disagreements about phone use
Phones can be lost, dropped or damaged when students are playing outside
Some families say it is harder to enforce screen limits at home afterwards
Basis for these points (optional)
Left empty
Uneven lists, with two short pros against five long cons, and no basis line. Checks the columns keep equal weight without padding or trimming, long cons wrap cleanly, and no verdict or extra argument is added.
Same task, three directions
Pick a direction to start from.
01
Level balance scale
A balance scale in the center with the points listed beneath each side, drawn level so it implies no answer.
02
Split poster
A tall poster split into two colored halves, ready for a classroom debate or a noticeboard.
03
Meeting slide table
A wide two-column table for the decision slide in a team meeting.
What the template keeps
The parts that stay consistent.
01
Balanced layout
Both columns get the same width and weight, even when the counts differ.
02
Markers plus color
Plus and minus markers carry the meaning, so it does not rely on red and green alone.
03
No verdict
The image lays out the arguments and leaves the decision to the reader.
How to use it
From details to a result.
01
State the option or decision
One option, or a decision phrased as a question. It becomes the title.
02
List the pros and the cons
One point per line in each box, short enough to read at a glance.
03
Say what the points are based on
Optional, but useful when the image will be shared beyond the people who made the list.
04
Review, generate and check
You confirm the brief in Vizify before generation starts. Then check that every point landed in the right column.
Output boundaries
What to check before you use it.
Pros, cons and the subject are drawn as image text. Check spelling and that each point stayed in the right column.
The template takes no side. It adds no points, scores, weights or verdict; add your own conclusion through the additional direction if you want one shown.
Two to six points per side fit. Several options compared on numbers such as price or specifications are better as a comparison chart from the chart tools.
Each request returns a single image. Square, wide and tall are framing directions rather than guaranteed sizes.
QuestionsCan I use it as a pros and cons poster for a class debate?+
Yes. Choose the portrait format and phrase the subject as the debate question. It is a generated image rather than a print file, so check the text is sharp at the size you print.
Can I compare two options at once?+
Make one image per option, or phrase the choice as a single decision, such as taking the train rather than driving. For options compared on figures, use a comparison chart.
Will it balance the lists for me?+
No. The layout is balanced, but your points are not padded or trimmed. An uneven list is often an honest part of the picture.
Can a pros and cons infographic show my conclusion?+
Yes, if you write it. Add the conclusion in the additional direction and it appears in a band under both columns.