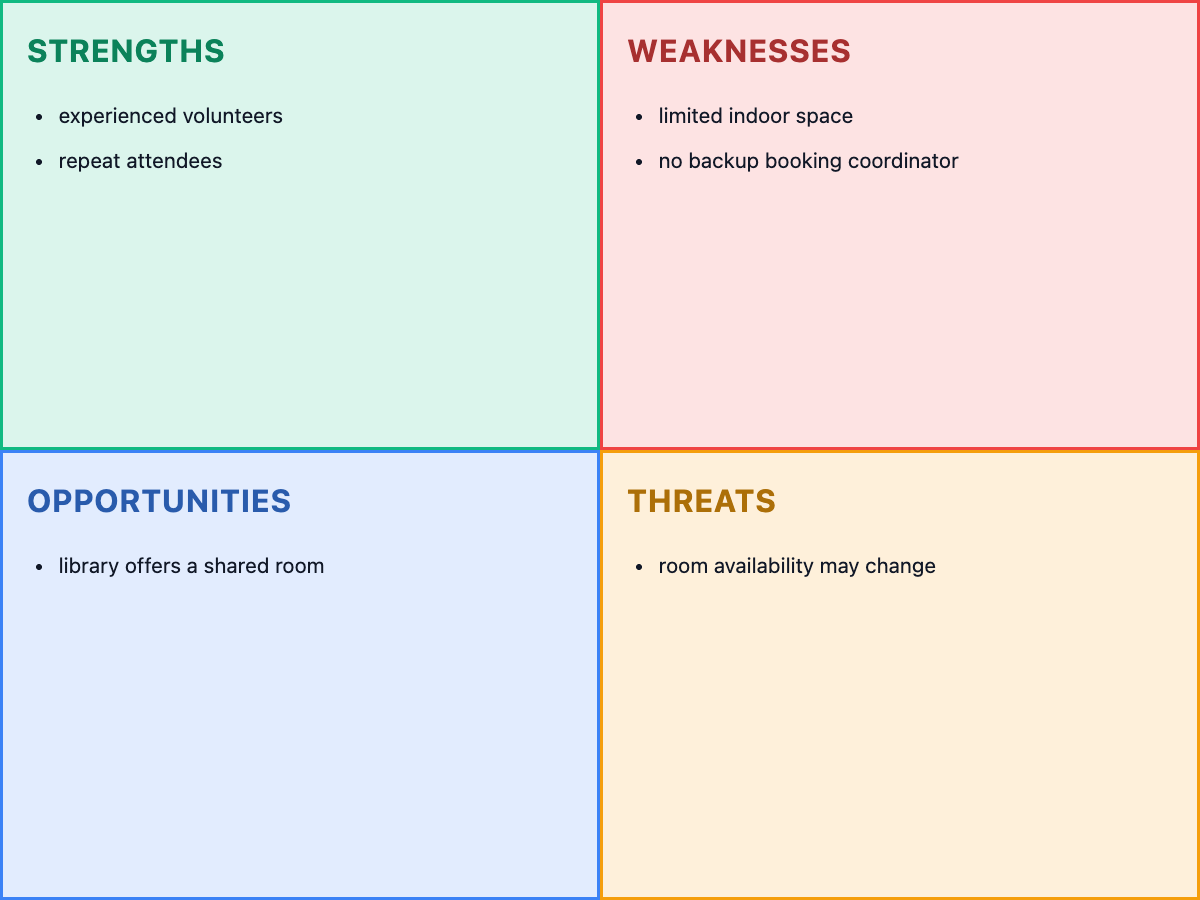
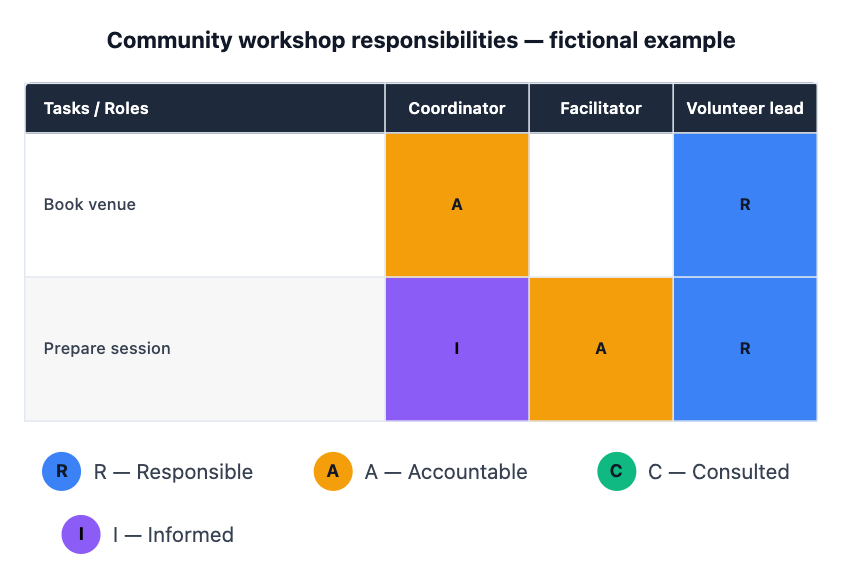
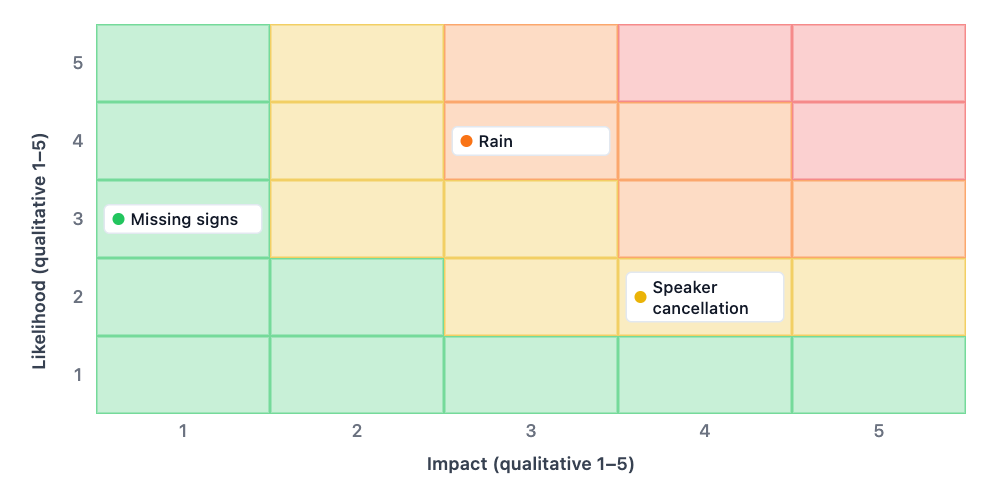
One four-part SWOT chart from your notes. Separate internal strengths and weaknesses from external opportunities and threats, keep assumptions labeled, and use the chart to choose questions for further investigation.
Opportunities: library offers a shared room. Threats: room availability may change. These are fictional planning notes.
What organization or decision are we assessing, and what confirmed information supports its strengths, weaknesses, opportunities and threats? Please distinguish internal conditions from external influences and include the scope or time horizon. I can organize your facts, but I will not present invented business claims as a completed SWOT.
Boundary input
Missing or conflicting input
Organization or decision
Our business, no details supplied
Strengths and weaknesses
Strengths and weaknesses not assessed.
Opportunities and threats
Opportunities and threats not assessed.
An unassessed organization needs questions or visible gaps, not invented strengths or market claims.
Same task, three directions
Pick a direction to start from.
01
Business decision SWOT
Organize supplied notes around one specific business decision.
02
Personal planning SWOT
Use your own observations for a personal goal without inventing character traits.
03
Evidence-first discussion
Keep assumptions distinct from observations when reviewing a team’s notes.
What the template keeps
The parts that stay consistent.
01
Your labels and values
The chart keeps the supplied wording, order and data rather than inventing a complete-looking result.
How to use it
From details to a result.
01
Define the scope
Name the project or decision and the source of the notes.
02
Paste the agreed inputs
Use the field labels and keep unknown or disputed details explicit.
03
Review and send in Vizify
Nothing runs until you send the prepared brief. Check the finished chart against the source notes.
Output boundaries
What to check before you use it.
All factual inputs come from you; no company or market research is performed.
An empty quadrant is a research gap, not an invitation to invent generic claims.
The chart organizes observations and does not establish causality, priorities or a validated strategy.
QuestionsWhat goes in each SWOT section?+
Strengths and weaknesses describe internal conditions; opportunities and threats describe external conditions. Keep the scope of the decision clear.
Will Vizify research my company or competitors?+
No. This template arranges the findings you paste. It does not verify market trends, prices or competitor features.
Can I use it for a personal SWOT?+
Yes. Define the decision and supply your own observations. Avoid treating generic personality suggestions as established facts about you.
Does a SWOT chart tell me which strategy to choose?+
Not by itself. Use the chart to discuss evidence and options; prioritization needs explicit goals, trade-offs and further judgment.