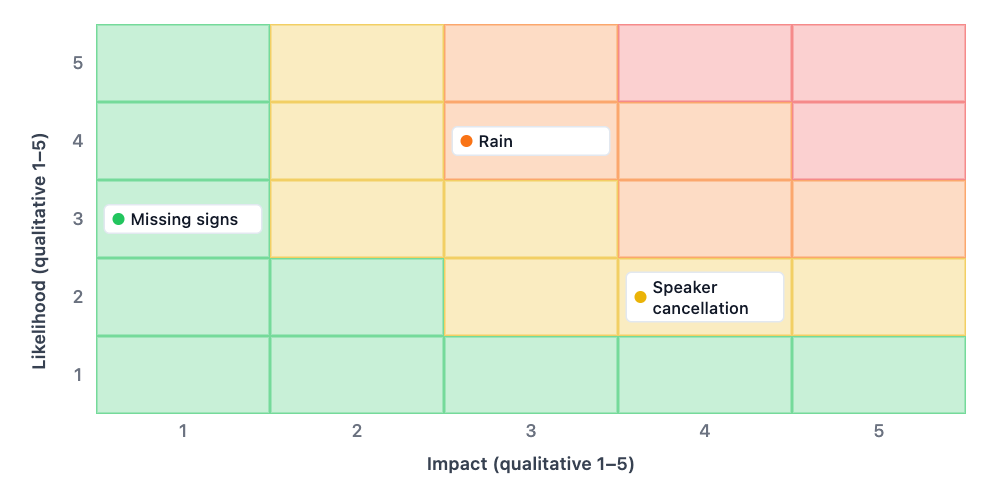
One 5×5 risk matrix based on your named risks and supplied 1–5 likelihood and impact scores. Keep the scale definitions with the brief, and treat the chart as a discussion aid rather than a validated risk assessment.
Please supply the rain impact score and correct the speaker-cancellation likelihood of 7, which is outside your stated 1–5 scale. Also define what each likelihood and impact level means for this workshop. I will not replace unknown values with invented scores or plot the invalid entries as valid assessments.
Boundary input
Missing or conflicting input
Decision and scope
Workshop planning, fictional example
What the 1–5 scales mean
Likelihood and impact each use 1–5, as qualitative judgments.
Risk | likelihood 1–5 | impact 1–5
Rain | 4 | unknown
Speaker cancellation | 7 | 4
Missing impact and an out-of-range likelihood must trigger a question, not invented or silently rescaled scores.
Same task, three directions
Pick a direction to start from.
01
Qualitative 5×5 planning view
Plot the supplied 1–5 likelihood and impact judgments with labels.
02
No calculated risk score
Show likelihood and impact without presenting their product as a calibrated measure.
03
Review uncertain ratings
Identify missing or out-of-range scores before plotting.
What the template keeps
The parts that stay consistent.
01
Your labels and values
The chart keeps the supplied wording, order and data rather than inventing a complete-looking result.
How to use it
From details to a result.
01
Define the scope
Name the project or decision and the source of the notes.
02
Paste the agreed inputs
Use the field labels and keep unknown or disputed details explicit.
03
Review and send in Vizify
Nothing runs until you send the prepared brief. Check the finished chart against the source notes.
Output boundaries
What to check before you use it.
The template uses a 5×5 grid and supplied 1–5 scores; missing scores remain questions.
Ordinal scores and colors do not establish calibrated probabilities, financial loss estimates or approved thresholds.
This is a planning visualization, not a professional safety, legal, medical or financial assessment.
QuestionsAre likelihood scores actual probabilities?+
Not unless your rubric explicitly defines and supports that meaning. A qualitative 1–5 rating should not be presented as a measured probability.
Can I use a different rating scale?+
This template is deliberately framed around the current 5×5, 1–5 input contract. Do not silently convert another scale; define and review any mapping first.
Does the color show my organization’s risk thresholds?+
Not automatically. Built-in colors are visual aids, not proof of approved risk appetite or compliance. State and review your organization’s criteria separately.
Does this replace a professional risk assessment?+
No. It organizes scores you supply. Evidence collection, mitigation decisions and domain-specific review remain separate responsibilities.