Raw numeric observations or bin edges and counts, plus units
Purpose and reader
Source and uncertainty
Inspect a numeric distribution by grouping observations into clearly defined bins.
Paste data as text. Review the brief in Vizify before sending it; no chart is generated on this page.
Raw numeric observations or bin edges and counts, plus units
Purpose and reader
Source and uncertainty
One histogram artifact
Inspect a numeric distribution by grouping observations into clearly defined bins.
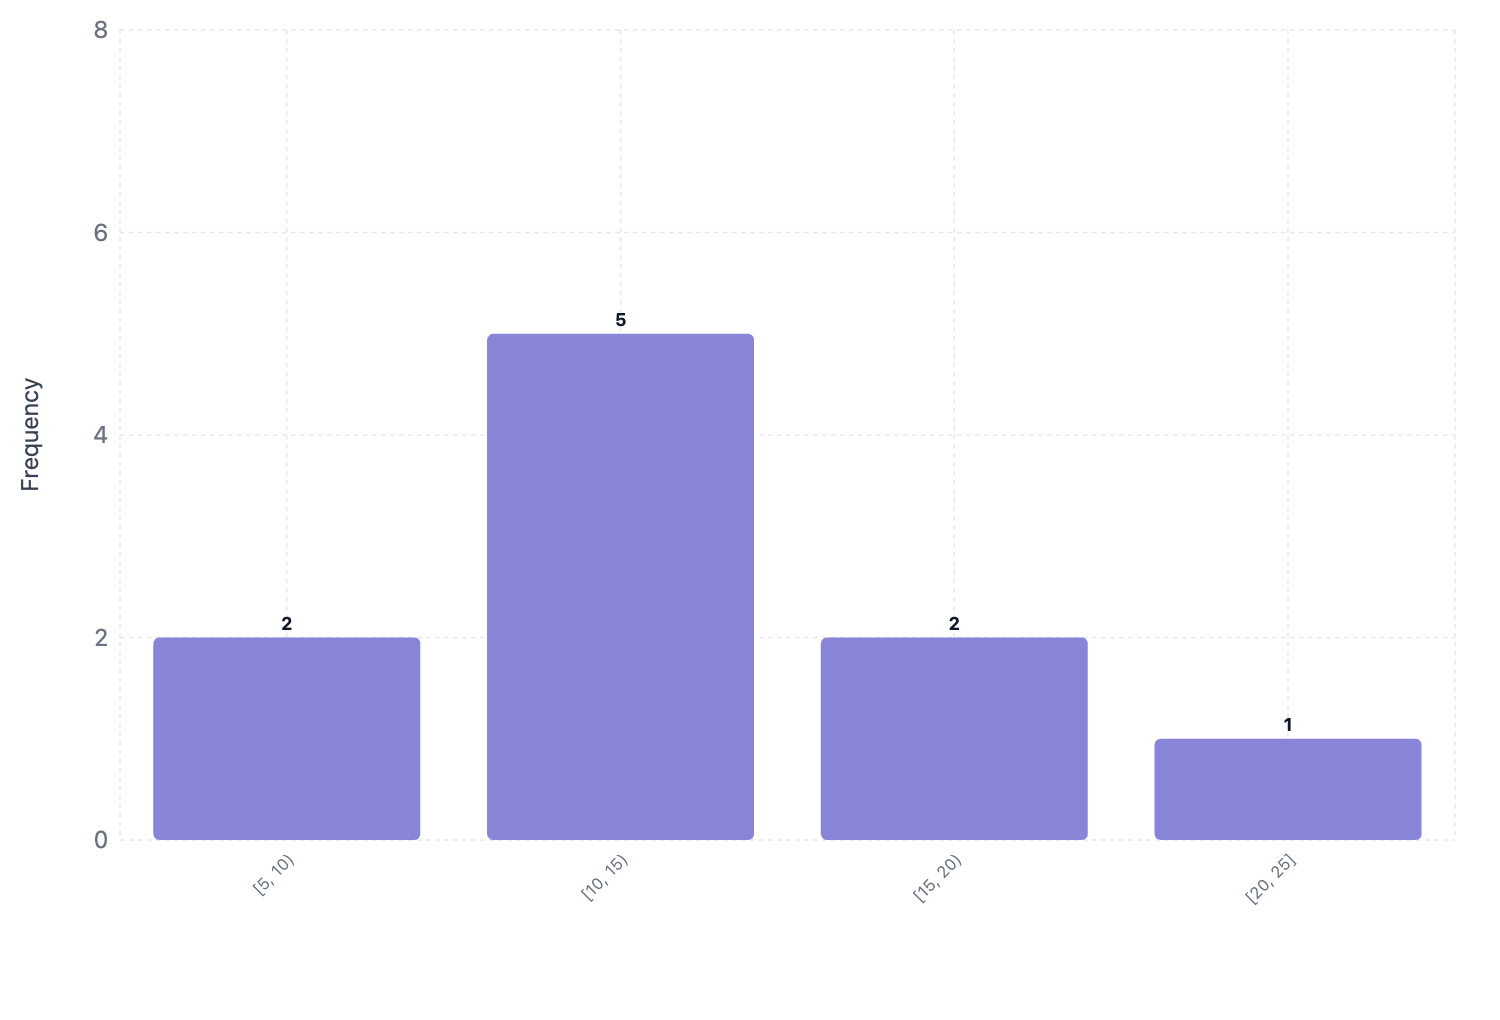
State bin edges and which boundary includes an equal value. Preserve total frequency and do not confuse categorical bars with numeric intervals.
Bin choices affect the shape. A histogram does not by itself establish a distribution model or explain outliers.
Make a histogram of sample delivery times in minutes: 8, 9, 10, 11, 11, 12, 14, 16, 17, 22. Use bins 5–10, 10–15, 15–20, 20–25; state edge inclusion.
Please supply the raw numeric observations and units, or explicit bin edges with counts. State how missing values and values exactly on bin boundaries should be treated. I will not reconstruct a distribution from an average or invent observations to fill empty bins.
Make a histogram, but I have not supplied raw numeric observations or bin edges and counts, plus units. Ask me for what is needed before creating it.
Checks that an incomplete request produces a question rather than invented data.
Provide raw numeric observations or bin edges and counts, plus units. Explain what the chart should communicate and state any unknown values.
A histogram groups numeric measurements into intervals. A bar chart compares distinct categories; their ordering and gaps have different meanings.
Yes. Provide the width and starting edge, or list every bin. Ask for the boundary convention so edge values are counted once.
For this histogram, the required input is raw numeric observations or bin edges and counts, plus units. Mark unknown entries clearly; a missing value or relationship should prompt a question, not an invented completion or an automatic zero.
Paste raw numeric observations or bin edges and counts, plus units as labeled text. This page does not import Excel or CSV attachments; review the pasted structure before sending.
State bin edges and which boundary includes an equal value. Preserve total frequency and do not confuse categorical bars with numeric intervals.
You receive one histogram artifact in Vizify. It preserves an underlying chart or diagram definition rather than a generated picture. Use that artifact’s available export options; no particular office-file format is promised.
Preparing the histogram brief does not generate a chart. Review the supplied raw numeric observations or bin edges and counts, plus units in Vizify and send the request to begin. The account’s current chart access and credit rules apply to generation and revisions.