Stage names, counts, time window and a consistent population
Purpose and reader
Source and uncertainty
Compare counts across ordered stages of the same process and make drop-offs easier to discuss.
Paste data as text. Review the brief in Vizify before sending it; no chart is generated on this page.
Stage names, counts, time window and a consistent population
Purpose and reader
Source and uncertainty
One funnel chart artifact
Compare counts across ordered stages of the same process and make drop-offs easier to discuss.
Use comparable cohorts and retain stage order. Compute rates only with stated denominators and distinguish overall from step-to-step conversion.
Mixed time windows or populations can produce misleading conversion rates even when the chart renders correctly.
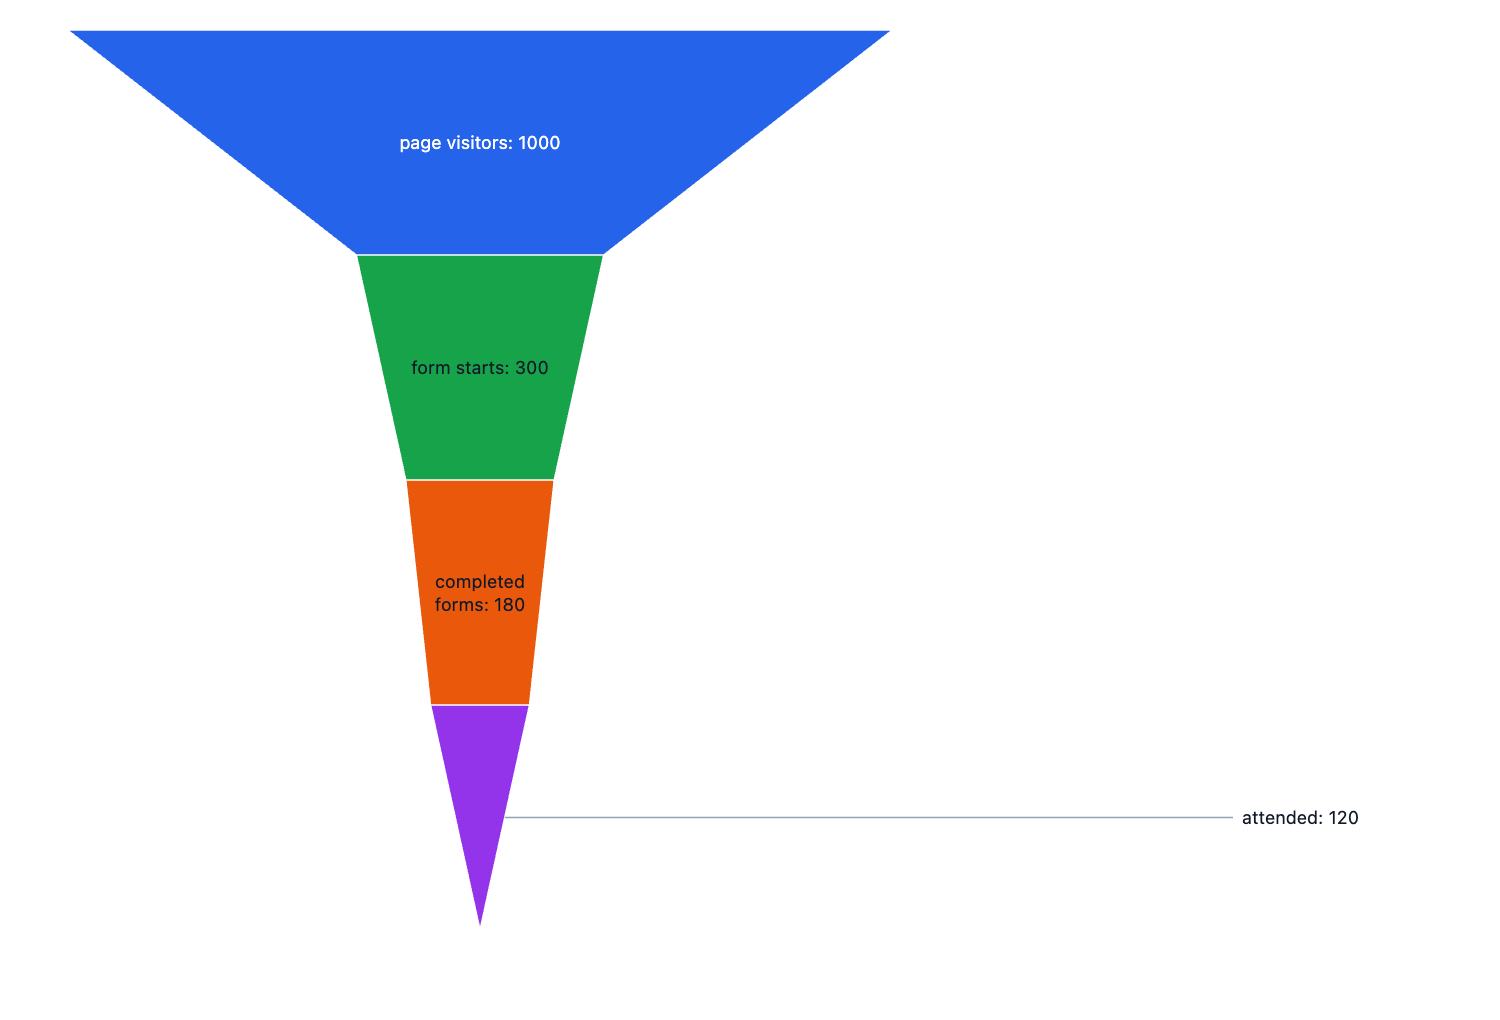
Create a funnel for a sample workshop signup flow: page visitors 1000, form starts 300, completed forms 180, attended 120. Keep the stage order and label counts.
Please give the stage names and counts, the reporting period and the population followed through the stages. Explain whether people can skip or repeat stages and whether every count uses the same definition. I will not calculate conversion rates from unrelated populations or invented denominators.
Make a funnel chart, but I have not supplied stage names, counts, time window and a consistent population. Ask me for what is needed before creating it.
Checks that an incomplete request produces a question rather than invented data.
Provide stage names, counts, time window and a consistent population. Explain what the chart should communicate and state any unknown values.
Yes. Specify whether each rate uses the prior stage or the first stage as denominator. Keep counts visible for context.
Check whether stages use the same cohort or whether people can enter midway. Do not force decreasing values just to make a funnel shape.
For this funnel chart, the required input is stage names, counts, time window and a consistent population. Mark unknown entries clearly; a missing value or relationship should prompt a question, not an invented completion or an automatic zero.
Paste stage names, counts, time window and a consistent population as labeled text. This page does not import Excel or CSV attachments; review the pasted structure before sending.
Use comparable cohorts and retain stage order. Compute rates only with stated denominators and distinguish overall from step-to-step conversion.
You receive one funnel chart artifact in Vizify. It preserves an underlying chart or diagram definition rather than a generated picture. Use that artifact’s available export options; no particular office-file format is promised.
Preparing the funnel chart brief does not generate a chart. Review the supplied stage names, counts, time window and a consistent population in Vizify and send the request to begin. The account’s current chart access and credit rules apply to generation and revisions.