Ordered x values, series values and units
Purpose and reader
Source and uncertainty
Show how a quantity changes across an ordered series, with the filled area making its overall scale visible.
Paste data as text. Review the brief in Vizify before sending it; no chart is generated on this page.
Ordered x values, series values and units
Purpose and reader
Source and uncertainty
One area chart artifact
Show how a quantity changes across an ordered series, with the filled area making its overall scale visible.
Keep a meaningful baseline and distinguish overlapping series. Use stacking only when the series genuinely add to a total.
A filled area can hide smaller series or exaggerate a truncated axis; it does not establish a causal relationship.
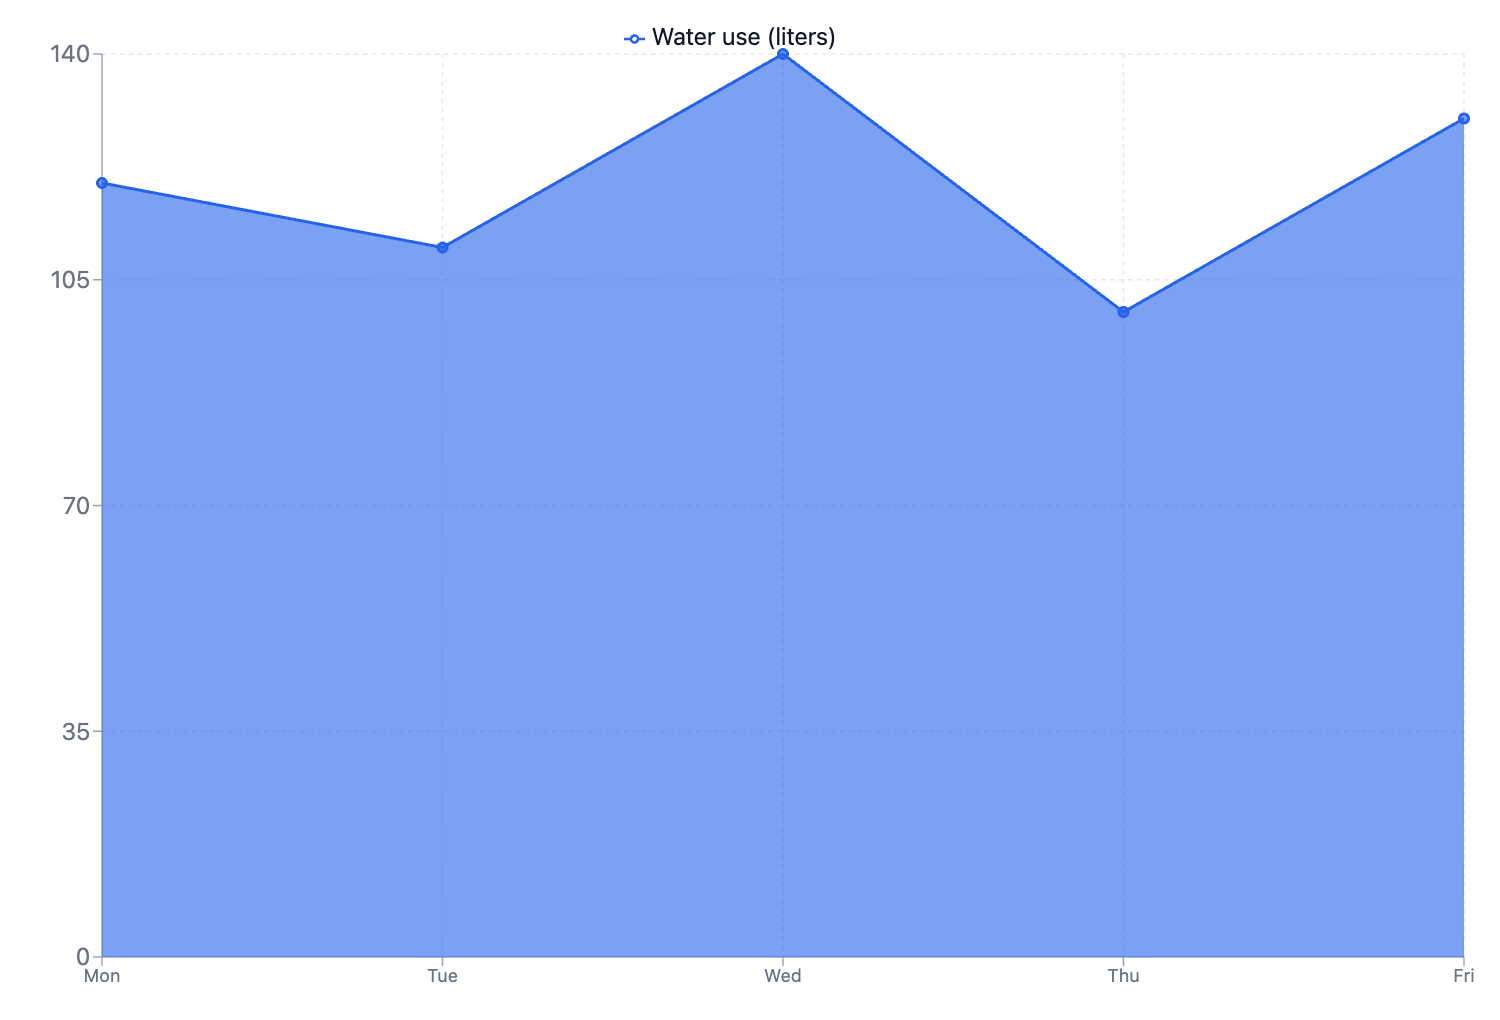
Create an area chart of water use in liters: Mon 120, Tue 110, Wed 140, Thu 100, Fri 130. Keep the weekdays in this order.
Please supply the ordered x values, each series of numeric values and their units, with a clear label for every series. Say whether you want overlapping or stacked areas and how missing observations should be handled. I will not invent values or treat unrelated categories as a continuous time series.
Create an area chart, but I have not supplied ordered x values, series values and units. Ask me for what is needed before creating it.
Checks that an incomplete request produces a question rather than invented data.
Provide ordered x values, series values and units. Explain what the chart should communicate and state any unknown values.
Use an area chart when magnitude or accumulation is part of the story. A line chart is often clearer when comparing several similar trends.
Yes, when the values share a unit and add meaningfully. Label each series and specify whether you want absolute totals; percentages need a clearly defined whole.
For this area chart, the required input is ordered x values, series values and units. Mark unknown entries clearly; a missing value or relationship should prompt a question, not an invented completion or an automatic zero.
Paste ordered x values, series values and units as labeled text. This page does not import Excel or CSV attachments; review the pasted structure before sending.
Keep a meaningful baseline and distinguish overlapping series. Use stacking only when the series genuinely add to a total.
You receive one area chart artifact in Vizify. It preserves an underlying chart or diagram definition rather than a generated picture. Use that artifact’s available export options; no particular office-file format is promised.
Preparing the area chart brief does not generate a chart. Review the supplied ordered x values, series values and units in Vizify and send the request to begin. The account’s current chart access and credit rules apply to generation and revisions.