Start, signed changes and explicitly marked totals with units
Purpose and reader
Source and uncertainty
Explain how a starting balance changes through signed increases and decreases to an ending total.
Paste data as text. Review the brief in Vizify before sending it; no chart is generated on this page.
Start, signed changes and explicitly marked totals with units
Purpose and reader
Source and uncertainty
One waterfall chart artifact
Explain how a starting balance changes through signed increases and decreases to an ending total.
Distinguish totals from deltas and check that the ending balance reconciles. Keep negative signs and units intact.
It does not read bank feeds, validate accounts or turn an unexplained difference into a balancing entry.
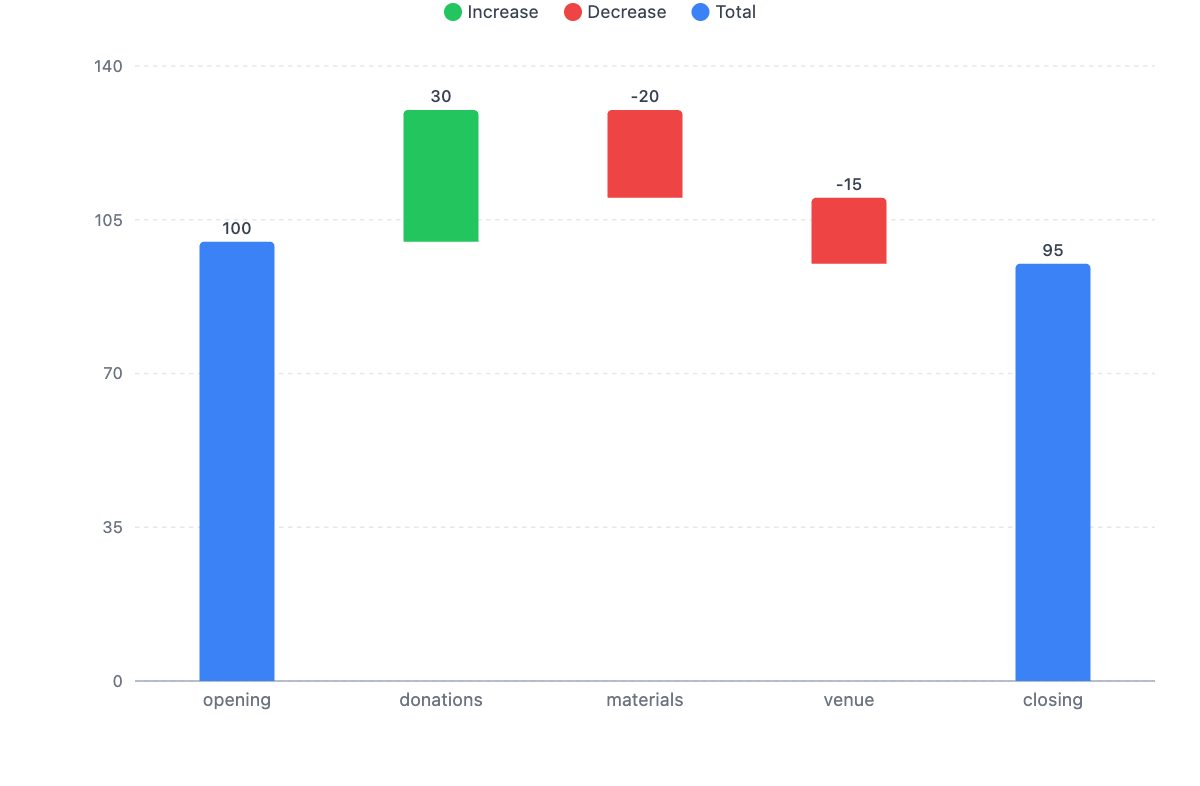
Make a waterfall: opening 100, donations +30, materials -20, venue -15, closing 95. Treat opening and closing as totals.
Please supply the starting value, each signed change and any explicitly marked totals, with a common unit. Clarify whether a row is an increment or a subtotal so it is not counted twice. I will not infer missing changes or force the final value to match an invented total.
Make a waterfall chart, but I have not supplied start, signed changes and explicitly marked totals with units. Ask me for what is needed before creating it.
Checks that an incomplete request produces a question rather than invented data.
Provide start, signed changes and explicitly marked totals with units. Explain what the chart should communicate and state any unknown values.
Mark each row as a total or a signed change. Without that distinction, an ending total could be incorrectly added as another increase.
Only when the changes share a clearly stated basis. Percentage-point differences are not the same as percentage changes.
For this waterfall chart, the required input is start, signed changes and explicitly marked totals with units. Mark unknown entries clearly; a missing value or relationship should prompt a question, not an invented completion or an automatic zero.
Paste start, signed changes and explicitly marked totals with units as labeled text. This page does not import Excel or CSV attachments; review the pasted structure before sending.
Distinguish totals from deltas and check that the ending balance reconciles. Keep negative signs and units intact.
You receive one waterfall chart artifact in Vizify. It preserves an underlying chart or diagram definition rather than a generated picture. Use that artifact’s available export options; no particular office-file format is promised.
Preparing the waterfall chart brief does not generate a chart. Review the supplied start, signed changes and explicitly marked totals with units in Vizify and send the request to begin. The account’s current chart access and credit rules apply to generation and revisions.