Parent-child categories and nonnegative values with units
Purpose and reader
Source and uncertainty
Compare positive part-to-whole values within a hierarchy using nested rectangles.
Paste data as text. Review the brief in Vizify before sending it; no chart is generated on this page.
Parent-child categories and nonnegative values with units
Purpose and reader
Source and uncertainty
One treemap artifact
Compare positive part-to-whole values within a hierarchy using nested rectangles.
Check leaf values and parent totals without double-counting parent summaries. Keep hierarchy and units visible.
Rectangle area is less precise than a labeled table; negative values cannot be represented as area.
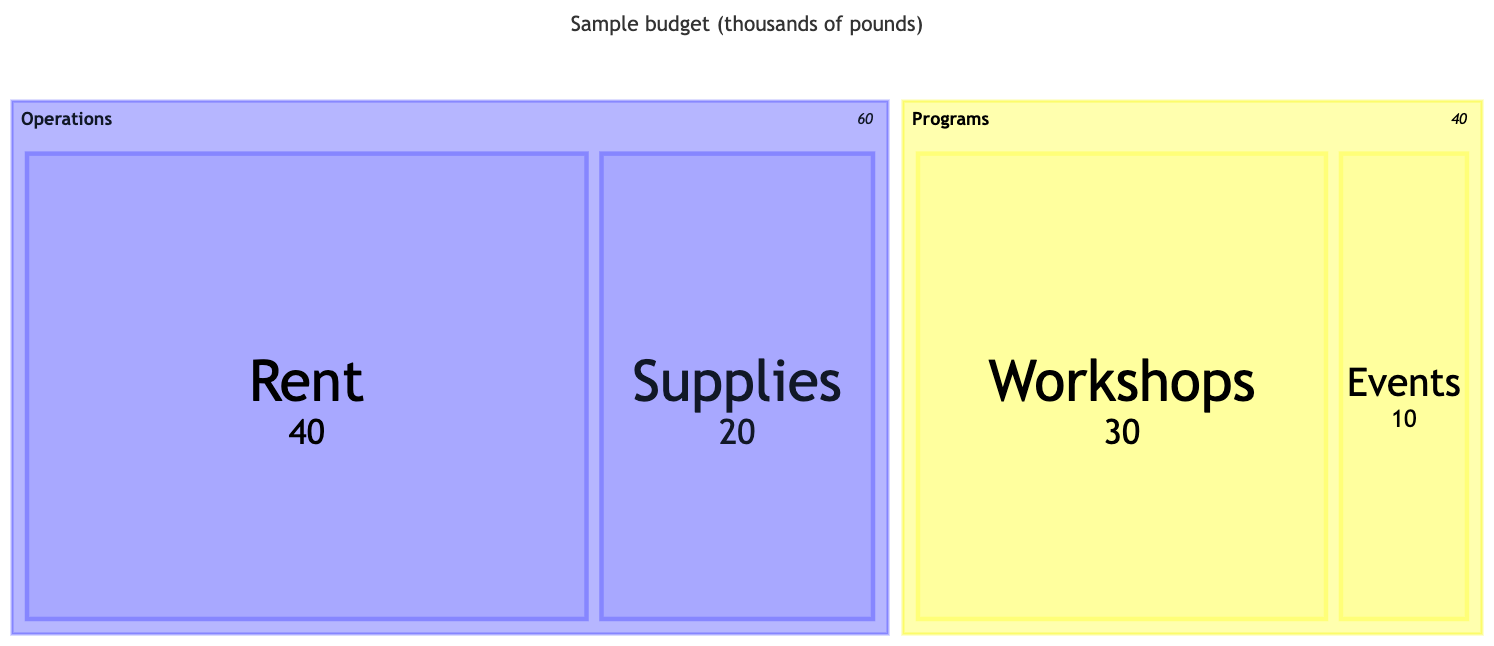
Create a treemap of a sample budget: Operations → Rent 40, Supplies 20; Programs → Workshops 30, Events 10. Unit: thousands of pounds.
Please provide the parent–child categories and nonnegative values, with units and scope. Clarify whether parent totals already include their children and how missing values should be handled. I will not double-count totals or invent category sizes.
Make a treemap, but I have not supplied parent-child categories and nonnegative values with units. Ask me for what is needed before creating it.
Checks that an incomplete request produces a question rather than invented data.
Provide parent-child categories and nonnegative values with units. Explain what the chart should communicate and state any unknown values.
Leaf values are usually sufficient. If you include parent totals, say whether they summarize the children so they are not added a second time.
A single treemap is a snapshot. For trends, a line or area chart is usually easier to interpret.
For this treemap, the required input is parent-child categories and nonnegative values with units. Mark unknown entries clearly; a missing value or relationship should prompt a question, not an invented completion or an automatic zero.
Paste parent-child categories and nonnegative values with units as labeled text. This page does not import Excel or CSV attachments; review the pasted structure before sending.
Check leaf values and parent totals without double-counting parent summaries. Keep hierarchy and units visible.
You receive one treemap artifact in Vizify. It preserves an underlying chart or diagram definition rather than a generated picture. Use that artifact’s available export options; no particular office-file format is promised.
Preparing the treemap brief does not generate a chart. Review the supplied parent-child categories and nonnegative values with units in Vizify and send the request to begin. The account’s current chart access and credit rules apply to generation and revisions.