Dates or periods, event labels and any required grouping
Purpose and reader
Source and uncertainty
Put dated events into chronological context without turning them into an invented project schedule.
Paste data as text. Review the brief in Vizify before sending it; no chart is generated on this page.
Dates or periods, event labels and any required grouping
Purpose and reader
Source and uncertainty
One timeline artifact
Put dated events into chronological context without turning them into an invented project schedule.
Keep stated date precision and order. Preserve uncertain dates as approximate and do not invent exact days or durations.
A timeline shows events; use a Gantt chart when you need dated task spans and dependencies.
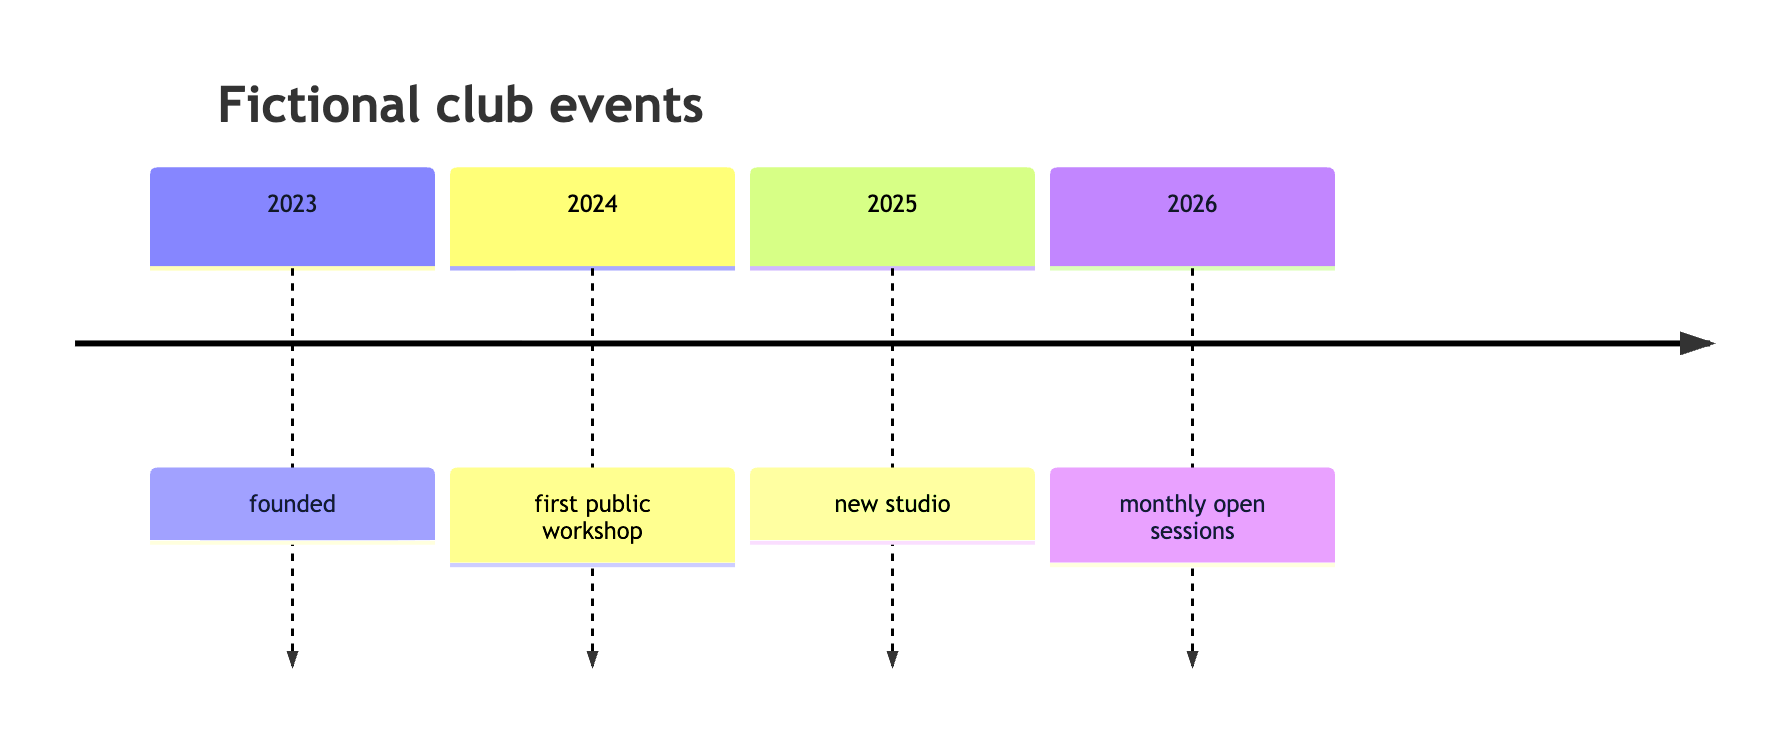
Create a timeline from these fictional club events: 2023 founded; 2024 first public workshop; 2025 new studio; 2026 monthly open sessions.
Please give the dates or periods, event labels and any grouping or time-zone convention. Mark approximate or uncertain dates and say how they should appear. I can visualize that chronology without inventing dates or changing the order of events.
Make a timeline, but I have not supplied dates or periods, event labels and any required grouping. Ask me for what is needed before creating it.
Checks that an incomplete request produces a question rather than invented data.
Provide dates or periods, event labels and any required grouping. Explain what the chart should communicate and state any unknown values.
Yes. Keep every date at the precision the source supports. A year should not silently become a specific day.
Yes, if you label dates as planned or tentative. The chart does not commit teams to milestones or track live progress.
For this timeline, the required input is dates or periods, event labels and any required grouping. Mark unknown entries clearly; a missing value or relationship should prompt a question, not an invented completion or an automatic zero.
Paste dates or periods, event labels and any required grouping as labeled text. This page does not import Excel or CSV attachments; review the pasted structure before sending.
Keep stated date precision and order. Preserve uncertain dates as approximate and do not invent exact days or durations.
You receive one timeline artifact in Vizify. It preserves an underlying chart or diagram definition rather than a generated picture. Use that artifact’s available export options; no particular office-file format is promised.
Preparing the timeline brief does not generate a chart. Review the supplied dates or periods, event labels and any required grouping in Vizify and send the request to begin. The account’s current chart access and credit rules apply to generation and revisions.