Two column headings and the text or paired entries for each
Purpose and reader
Source and uncertainty
Arrange two labeled sides of a comparison as a readable two-column chart.
Paste data as text. Review the brief in Vizify before sending it; no chart is generated on this page.
Two column headings and the text or paired entries for each
Purpose and reader
Source and uncertainty
One t chart artifact
Arrange two labeled sides of a comparison as a readable two-column chart.
Preserve which side each point belongs to and keep paired rows aligned when supplied. Do not invent a winner or weighted score.
A T-chart organizes notes; it does not perform research or substantiate opinions.
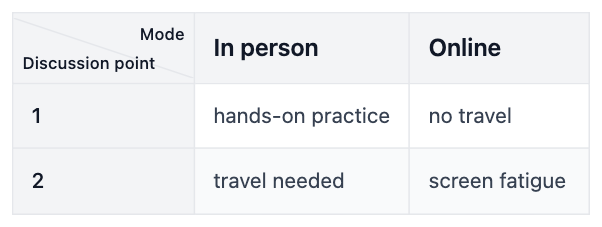
Make a T-chart for a fictional workshop: In person → hands-on practice, travel needed; Online → no travel, screen fatigue. Keep these as discussion points, not measured facts.
Please provide the two column headings and the entries to place under each, stating whether rows are paired. Explain the purpose of the comparison and any ordering you want. I will not invent positions or imply one-to-one matches when the supplied entries are independent.
Make a t chart, but I have not supplied two column headings and the text or paired entries for each. Ask me for what is needed before creating it.
Checks that an incomplete request produces a question rather than invented data.
Provide two column headings and the text or paired entries for each. Explain what the chart should communicate and state any unknown values.
Yes. Name the decision and put each point under the appropriate heading. Label assumptions so they do not look like established facts.
No, unless you are pairing rows. Say whether items are independent lists or matched comparisons so blanks are not filled with invented points.
For this t chart, the required input is two column headings and the text or paired entries for each. Mark unknown entries clearly; a missing value or relationship should prompt a question, not an invented completion or an automatic zero.
Paste two column headings and the text or paired entries for each as labeled text. This page does not import Excel or CSV attachments; review the pasted structure before sending.
Preserve which side each point belongs to and keep paired rows aligned when supplied. Do not invent a winner or weighted score.
You receive one t chart artifact in Vizify. It preserves an underlying chart or diagram definition rather than a generated picture. Use that artifact’s available export options; no particular office-file format is promised.
Preparing the t chart brief does not generate a chart. Review the supplied two column headings and the text or paired entries for each in Vizify and send the request to begin. The account’s current chart access and credit rules apply to generation and revisions.