Numeric values and a stem/leaf place-value key
Purpose and reader
Source and uncertainty
Display a small numeric dataset in ordered stems and leaves while keeping the original observations recoverable.
Paste data as text. Review the brief in Vizify before sending it; no chart is generated on this page.
Numeric values and a stem/leaf place-value key
Purpose and reader
Source and uncertainty
One stem and leaf plot artifact
Display a small numeric dataset in ordered stems and leaves while keeping the original observations recoverable.
Sort stems and leaves, preserve duplicates and include the place-value key. Do not silently round decimal observations.
Large ranges or high precision can make the plot unreadable; it is intended for compact datasets.
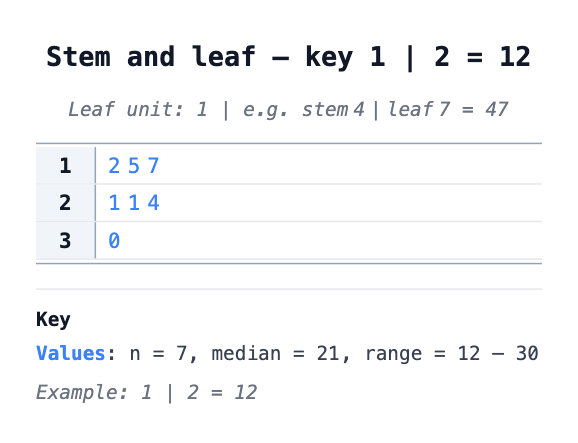
Make a stem-and-leaf plot for 12, 15, 17, 21, 21, 24, 30. Key: 1 | 2 = 12. Keep duplicate leaves.
Please provide the numeric values and the stem-and-leaf place-value key, including the units. Explain rounding, decimal precision and whether negative values occur. I will preserve repeated observations and will not choose an unstated scale that changes the values.
Make a stem and leaf plot, but I have not supplied numeric values and a stem/leaf place-value key. Ask me for what is needed before creating it.
Checks that an incomplete request produces a question rather than invented data.
Provide numeric values and a stem/leaf place-value key. Explain what the chart should communicate and state any unknown values.
The key defines the place values. For example, 1 | 2 = 12 differs from 1 | 2 = 1.2, so it must be explicit.
Yes, with a key that states the precision. Check that the renderer preserves every supplied value and does not collapse duplicates.
For this stem and leaf plot, the required input is numeric values and a stem/leaf place-value key. Mark unknown entries clearly; a missing value or relationship should prompt a question, not an invented completion or an automatic zero.
Paste numeric values and a stem/leaf place-value key as labeled text. This page does not import Excel or CSV attachments; review the pasted structure before sending.
Sort stems and leaves, preserve duplicates and include the place-value key. Do not silently round decimal observations.
You receive one stem and leaf plot artifact in Vizify. It preserves an underlying chart or diagram definition rather than a generated picture. Use that artifact’s available export options; no particular office-file format is promised.
Preparing the stem and leaf plot brief does not generate a chart. Review the supplied numeric values and a stem/leaf place-value key in Vizify and send the request to begin. The account’s current chart access and credit rules apply to generation and revisions.