Source, destination and nonnegative quantity for every flow
Purpose and reader
Source and uncertainty
Show quantities moving between named stages with flow widths tied to their values.
Paste data as text. Review the brief in Vizify before sending it; no chart is generated on this page.
Source, destination and nonnegative quantity for every flow
Purpose and reader
Source and uncertainty
One sankey diagram artifact
Show quantities moving between named stages with flow widths tied to their values.
Keep flow values and units intact. Check totals where conservation is intended and flag unexplained gains or losses instead of balancing them by invention.
A Sankey cannot represent negative flow widths; cycles and very dense networks may need a different layout.
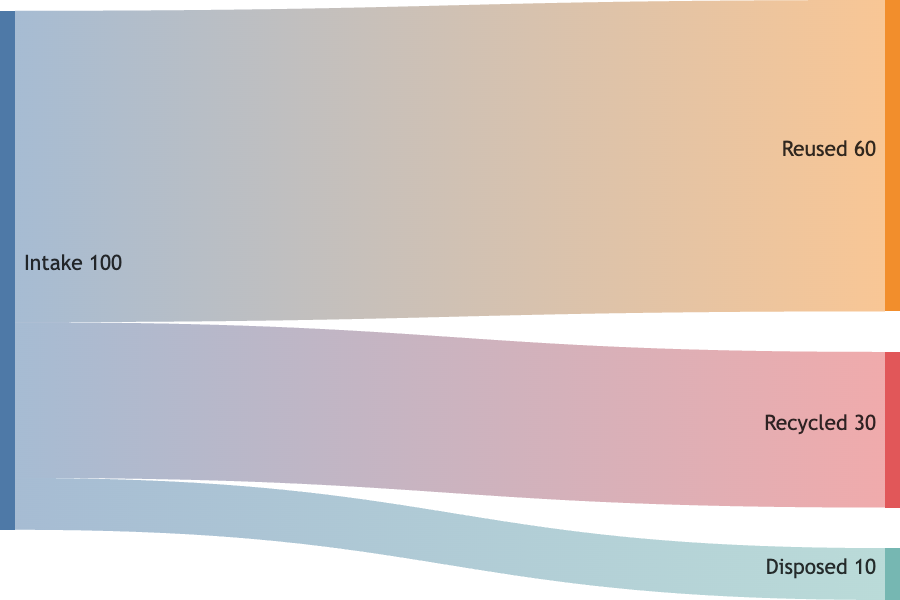
Create a Sankey from sample flows: Intake → Reused 60; Intake → Recycled 30; Intake → Disposed 10. Unit: kilograms.
Please provide a source, destination and nonnegative quantity for every flow, with a common unit and scope. Explain any losses, gains or boundary nodes so totals can be interpreted correctly. I will not invent balancing flows or imply conservation where your data do not establish it.
Make a sankey diagram, but I have not supplied source, destination and nonnegative quantity for every flow. Ask me for what is needed before creating it.
Checks that an incomplete request produces a question rather than invented data.
Provide source, destination and nonnegative quantity for every flow. Explain what the chart should communicate and state any unknown values.
Yes. Put each flow on its own line with source, target and value. Use one unit throughout or explain conversions explicitly.
They should when your process conserves the measured quantity. If they do not, explain the difference or keep it visible as a data gap.
For this sankey diagram, the required input is source, destination and nonnegative quantity for every flow. Mark unknown entries clearly; a missing value or relationship should prompt a question, not an invented completion or an automatic zero.
Paste source, destination and nonnegative quantity for every flow as labeled text. This page does not import Excel or CSV attachments; review the pasted structure before sending.
Keep flow values and units intact. Check totals where conservation is intended and flag unexplained gains or losses instead of balancing them by invention.
You receive one sankey diagram artifact in Vizify. It preserves an underlying chart or diagram definition rather than a generated picture. Use that artifact’s available export options; no particular office-file format is promised.
Preparing the sankey diagram brief does not generate a chart. Review the supplied source, destination and nonnegative quantity for every flow in Vizify and send the request to begin. The account’s current chart access and credit rules apply to generation and revisions.