Age bands and two nonnegative count series with units
Purpose and reader
Source and uncertainty
Compare two populations across the same ordered age bands in a mirrored bar layout.
Paste data as text. Review the brief in Vizify before sending it; no chart is generated on this page.
Age bands and two nonnegative count series with units
Purpose and reader
Source and uncertainty
One population pyramid artifact
Compare two populations across the same ordered age bands in a mirrored bar layout.
Use matching age bands, a common magnitude scale and nonnegative source counts. Mirror the visual without changing the meaning of counts.
It uses supplied data and does not fetch census figures or infer demographic trends.
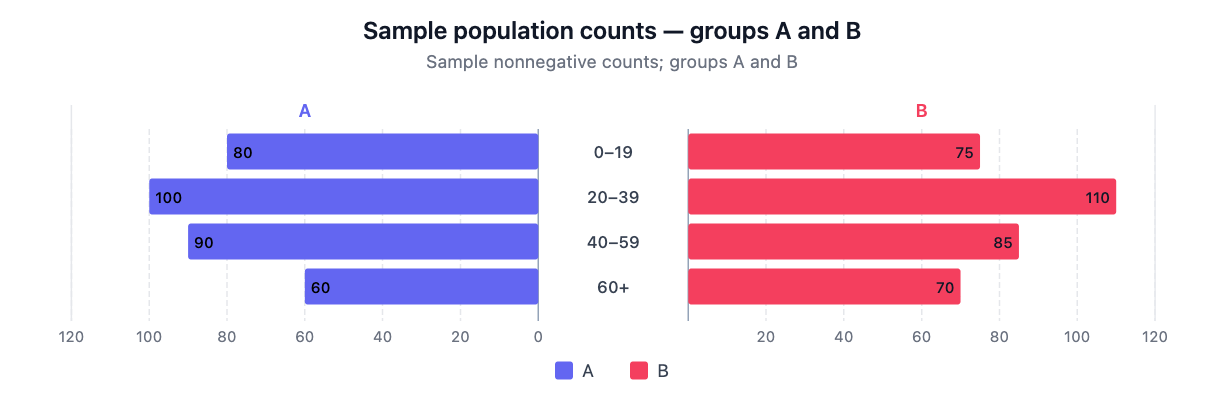
Draw a population pyramid using sample counts: ages 0–19 A 80 B 75; 20–39 A 100 B 110; 40–59 A 90 B 85; 60+ A 60 B 70. Label groups A and B.
Please supply ordered age bands and two nonnegative count series, with labels and units. Say whether the figures are counts or percentages and identify the population and reporting date. I will not use negative population counts or invent demographic groups to complete the chart.
Make a population pyramid, but I have not supplied age bands and two nonnegative count series with units. Ask me for what is needed before creating it.
Checks that an incomplete request produces a question rather than invented data.
Provide age bands and two nonnegative count series with units. Explain what the chart should communicate and state any unknown values.
No. You can compare any two clearly named populations using the same age bands. Do not infer group labels from the numbers.
Yes. Specify whether percentages are within each group or of the combined population. These denominators produce different interpretations.
For this population pyramid, the required input is age bands and two nonnegative count series with units. Mark unknown entries clearly; a missing value or relationship should prompt a question, not an invented completion or an automatic zero.
Paste age bands and two nonnegative count series with units as labeled text. This page does not import Excel or CSV attachments; review the pasted structure before sending.
Use matching age bands, a common magnitude scale and nonnegative source counts. Mirror the visual without changing the meaning of counts.
You receive one population pyramid artifact in Vizify. It preserves an underlying chart or diagram definition rather than a generated picture. Use that artifact’s available export options; no particular office-file format is promised.
Preparing the population pyramid brief does not generate a chart. Review the supplied age bands and two nonnegative count series with units in Vizify and send the request to begin. The account’s current chart access and credit rules apply to generation and revisions.