Row and column labels, numeric cell values and units
Purpose and reader
Source and uncertainty
Compare a matrix of values using labeled cells and a meaningful color scale.
Paste data as text. Review the brief in Vizify before sending it; no chart is generated on this page.
Row and column labels, numeric cell values and units
Purpose and reader
Source and uncertainty
One heatmap artifact
Compare a matrix of values using labeled cells and a meaningful color scale.
Use a shared scale for comparable cells. Keep missing data distinct from zero and state any normalization.
This is a data-matrix heatmap, not website click tracking, a geographic map layer or a thermal measurement.
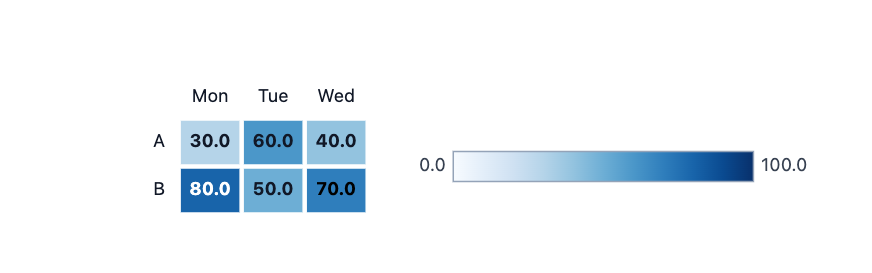
Make a heatmap of sample room occupancy percentages: A Mon 30 Tue 60 Wed 40; B Mon 80 Tue 50 Wed 70. Use a shared 0–100 scale.
Please provide row labels, column labels and a numeric value for each cell, including units. Mark missing values separately from zero and explain whether rows need normalization. I will not choose a color scale that hides missing data or invent cells to fill the grid.
Make a heatmap, but I have not supplied row and column labels, numeric cell values and units. Ask me for what is needed before creating it.
Checks that an incomplete request produces a question rather than invented data.
Provide row and column labels, numeric cell values and units. Explain what the chart should communicate and state any unknown values.
Yes. Paste labeled rows and columns as text. State units and use an explicit marker such as NA for missing values.
It cannot collect cursor or click behavior. You can chart counts you already measured, but there is no tracking installation here.
For this heatmap, the required input is row and column labels, numeric cell values and units. Mark unknown entries clearly; a missing value or relationship should prompt a question, not an invented completion or an automatic zero.
Paste row and column labels, numeric cell values and units as labeled text. This page does not import Excel or CSV attachments; review the pasted structure before sending.
Use a shared scale for comparable cells. Keep missing data distinct from zero and state any normalization.
You receive one heatmap artifact in Vizify. It preserves an underlying chart or diagram definition rather than a generated picture. Use that artifact’s available export options; no particular office-file format is promised.
Preparing the heatmap brief does not generate a chart. Review the supplied row and column labels, numeric cell values and units in Vizify and send the request to begin. The account’s current chart access and credit rules apply to generation and revisions.