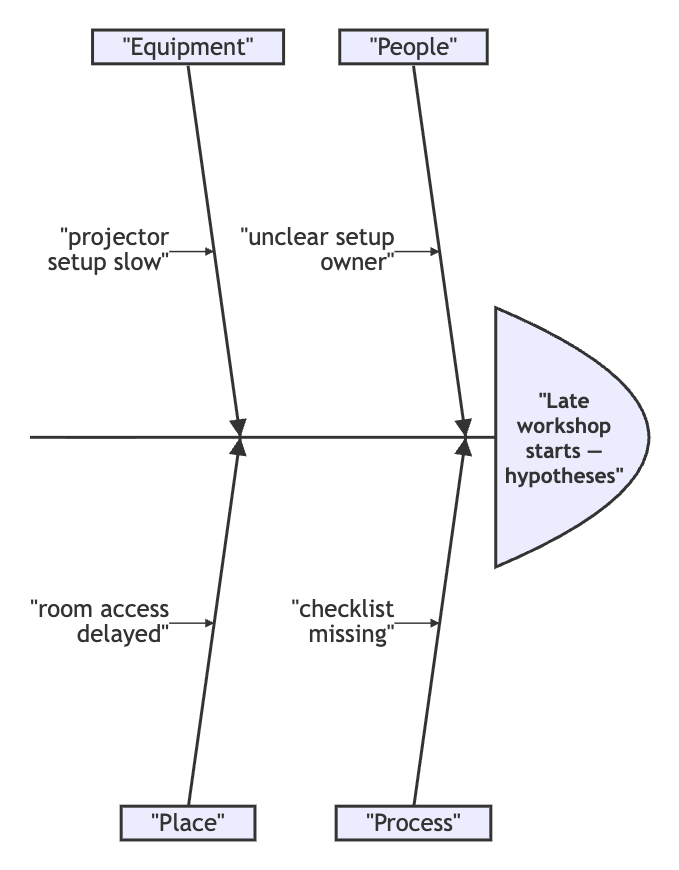
Problem statement, cause categories and specific candidate causes
Purpose and reader
Source and uncertainty
Group possible causes around one defined effect for a structured cause-and-effect discussion.
Paste data as text. Review the brief in Vizify before sending it; no chart is generated on this page.
Problem statement, cause categories and specific candidate causes
Purpose and reader
Source and uncertainty
One fishbone diagram artifact
Group possible causes around one defined effect for a structured cause-and-effect discussion.
Keep the effect separate from candidate causes. Preserve uncertainty and do not promote a brainstorming suggestion to a proven root cause.
A fishbone diagram does not test causes, calculate causal influence or establish responsibility.
Create a fishbone for late workshop starts. People: unclear setup owner. Process: checklist missing. Equipment: projector setup slow. Place: room access delayed. Mark all as hypotheses.
Please state the problem, the cause categories and the specific candidate causes to place under each. Distinguish observations from hypotheses and identify any evidence already available. The diagram can organize possible explanations, but it does not establish which cause has been proven.
Make a fishbone diagram, but I have not supplied problem statement, cause categories and specific candidate causes. Ask me for what is needed before creating it.
Checks that an incomplete request produces a question rather than invented data.
Provide problem statement, cause categories and specific candidate causes. Explain what the chart should communicate and state any unknown values.
No. Supply categories that suit the problem. Manufacturing categories are useful in some settings but need not fit a service or team process.
It can organize or suggest hypotheses if requested. A root-cause conclusion needs evidence from investigation, not just the diagram.
For this fishbone diagram, the required input is problem statement, cause categories and specific candidate causes. Mark unknown entries clearly; a missing value or relationship should prompt a question, not an invented completion or an automatic zero.
Paste problem statement, cause categories and specific candidate causes as labeled text. This page does not import Excel or CSV attachments; review the pasted structure before sending.
Keep the effect separate from candidate causes. Preserve uncertainty and do not promote a brainstorming suggestion to a proven root cause.
You receive one fishbone diagram artifact in Vizify. It preserves an underlying chart or diagram definition rather than a generated picture. Use that artifact’s available export options; no particular office-file format is promised.
Preparing the fishbone diagram brief does not generate a chart. Review the supplied problem statement, cause categories and specific candidate causes in Vizify and send the request to begin. The account’s current chart access and credit rules apply to generation and revisions.