Numeric observations, scale units and group labels if needed
Purpose and reader
Source and uncertainty
Show the frequency of individual numeric values using dots on a shared scale.
Paste data as text. Review the brief in Vizify before sending it; no chart is generated on this page.
Numeric observations, scale units and group labels if needed
Purpose and reader
Source and uncertainty
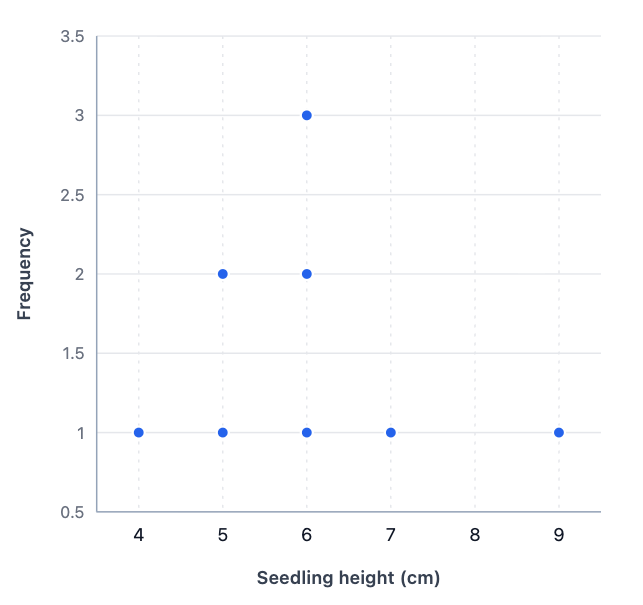
One dot plot artifact
Show the frequency of individual numeric values using dots on a shared scale.
Keep each observation represented and show repeated values as frequency rather than dropping duplicates.
A dot plot can become crowded for large datasets or many distinct decimal values.
Make a dot plot of these seedling heights in cm: 4, 5, 5, 6, 6, 6, 7, 9. Stack dots for repeated values.
Please supply the numeric observations, the measurement unit and any group labels. Tell me whether repeated values should be stacked and whether groups share a scale. I will preserve duplicate observations and will not substitute category totals for the missing raw values.
Make a dot plot, but I have not supplied numeric observations, scale units and group labels if needed. Ask me for what is needed before creating it.
Checks that an incomplete request produces a question rather than invented data.
Provide numeric observations, scale units and group labels if needed. Explain what the chart should communicate and state any unknown values.
No. This page targets stacked frequency dots along a numeric scale. A scatter plot places paired x/y measurements in two dimensions.
Yes. State the precision and spacing. Do not round or bin values silently; approve any grouping first.
For this dot plot, the required input is numeric observations, scale units and group labels if needed. Mark unknown entries clearly; a missing value or relationship should prompt a question, not an invented completion or an automatic zero.
Paste numeric observations, scale units and group labels if needed as labeled text. This page does not import Excel or CSV attachments; review the pasted structure before sending.
Keep each observation represented and show repeated values as frequency rather than dropping duplicates.
You receive one dot plot artifact in Vizify. It preserves an underlying chart or diagram definition rather than a generated picture. Use that artifact’s available export options; no particular office-file format is promised.
Preparing the dot plot brief does not generate a chart. Review the supplied numeric observations, scale units and group labels if needed in Vizify and send the request to begin. The account’s current chart access and credit rules apply to generation and revisions.