Item names, x and y values, nonnegative size values and units
Purpose and reader
Source and uncertainty
Compare items across two numeric axes while using bubble size to show a third measure.
Paste data as text. Review the brief in Vizify before sending it; no chart is generated on this page.
Item names, x and y values, nonnegative size values and units
Purpose and reader
Source and uncertainty
One bubble chart artifact
Compare items across two numeric axes while using bubble size to show a third measure.
Treat bubble area, not radius, as the third quantity. Keep axes and size units explicit and avoid using size for negative values.
Overlapping circles can hide items; bubble size is harder to compare precisely than position.
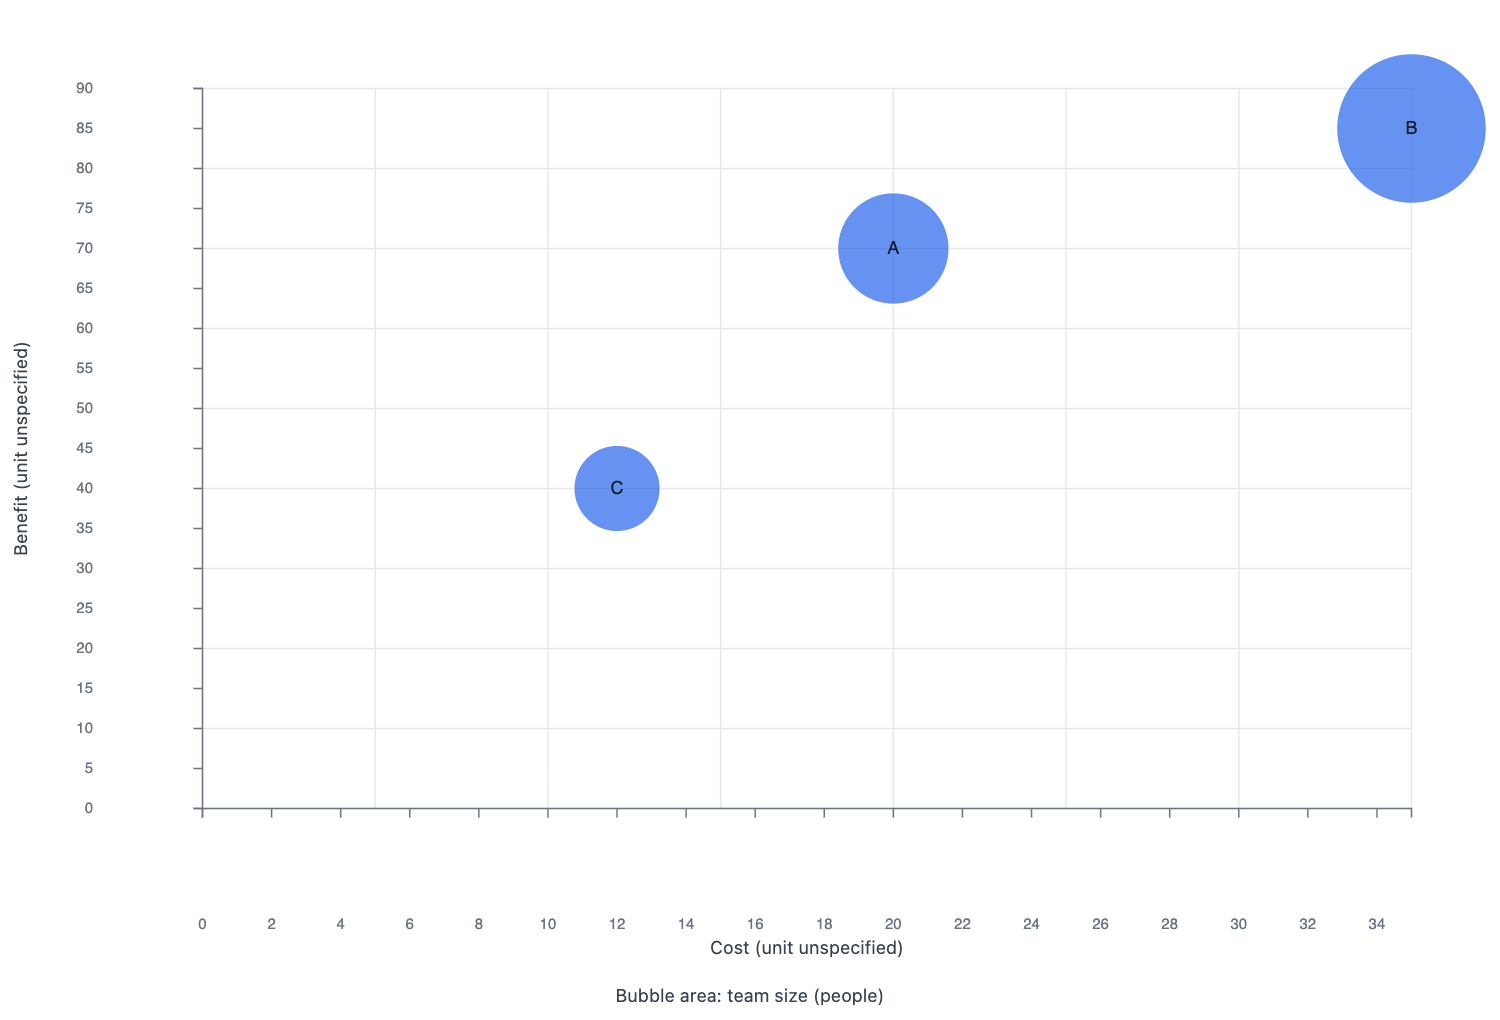
Plot sample projects: A cost 20, benefit 70, team size 5; B 35, 85, 9; C 12, 40, 3. Label axes and make bubble area represent team size.
Please provide an item label, x value, y value and nonnegative size value for every bubble, with units for all three measures. Specify whether any values are missing and what the bubble area should represent. I will not assign invented bubble sizes or silently change the size meaning.
Make a bubble chart, but I have not supplied item names, x and y values, nonnegative size values and units. Ask me for what is needed before creating it.
Checks that an incomplete request produces a question rather than invented data.
Provide item names, x and y values, nonnegative size values and units. Explain what the chart should communicate and state any unknown values.
Both use x and y position. A bubble chart adds a third measure through size, so each row needs that value as well.
An axis may contain negative values when the data calls for them. Bubble size must use a meaningful nonnegative measure.
For this bubble chart, the required input is item names, x and y values, nonnegative size values and units. Mark unknown entries clearly; a missing value or relationship should prompt a question, not an invented completion or an automatic zero.
Paste item names, x and y values, nonnegative size values and units as labeled text. This page does not import Excel or CSV attachments; review the pasted structure before sending.
Treat bubble area, not radius, as the third quantity. Keep axes and size units explicit and avoid using size for negative values.
You receive one bubble chart artifact in Vizify. It preserves an underlying chart or diagram definition rather than a generated picture. Use that artifact’s available export options; no particular office-file format is promised.
Preparing the bubble chart brief does not generate a chart. Review the supplied item names, x and y values, nonnegative size values and units in Vizify and send the request to begin. The account’s current chart access and credit rules apply to generation and revisions.