Raw observations per group, or five-number summaries with their convention
Purpose and reader
Source and uncertainty
Compare distributions using a box, median and whiskers rather than hiding variation behind one average.
Paste data as text. Review the brief in Vizify before sending it; no chart is generated on this page.
Raw observations per group, or five-number summaries with their convention
Purpose and reader
Source and uncertainty
One box and whisker plot artifact
Compare distributions using a box, median and whiskers rather than hiding variation behind one average.
State whether whiskers mean min/max or an outlier rule. Check the order min ≤ Q1 ≤ median ≤ Q3 ≤ max before plotting.
A five-number summary cannot reveal individual outliers or sample size unless those are supplied separately.
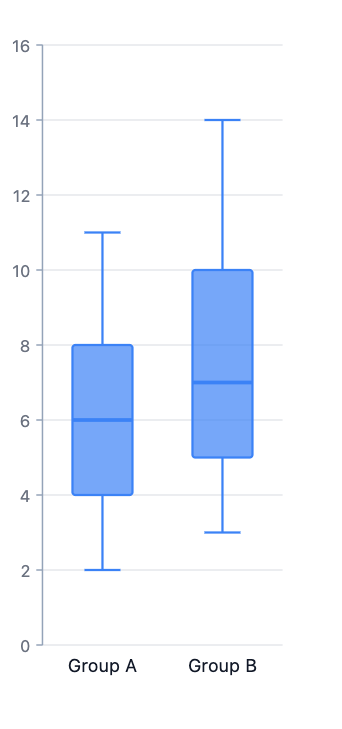
Draw a box plot from supplied summaries: Group A min 2 Q1 4 median 6 Q3 8 max 11; Group B min 3 Q1 5 median 7 Q3 10 max 14. Use min-to-max whiskers.
Please provide raw observations for each group, or a five-number summary with the quartile and whisker convention stated. Include the units and how outliers should be handled. A box plot cannot recover missing distributions from a group name or mean alone.
Make a box and whisker plot, but I have not supplied raw observations per group, or five-number summaries with their convention. Ask me for what is needed before creating it.
Checks that an incomplete request produces a question rather than invented data.
Provide raw observations per group, or five-number summaries with their convention. Explain what the chart should communicate and state any unknown values.
Yes. Label each group and ask for the summary calculation to be explained. Quartile methods differ, so state a required convention when your course or report has one.
No. Some plots use 1.5 times the interquartile range. Supply the convention; do not interpret a chart without checking it.
For this box and whisker plot, the required input is raw observations per group, or five-number summaries with their convention. Mark unknown entries clearly; a missing value or relationship should prompt a question, not an invented completion or an automatic zero.
Paste raw observations per group, or five-number summaries with their convention as labeled text. This page does not import Excel or CSV attachments; review the pasted structure before sending.
State whether whiskers mean min/max or an outlier rule. Check the order min ≤ Q1 ≤ median ≤ Q3 ≤ max before plotting.
You receive one box and whisker plot artifact in Vizify. It preserves an underlying chart or diagram definition rather than a generated picture. Use that artifact’s available export options; no particular office-file format is promised.
Preparing the box and whisker plot brief does not generate a chart. Review the supplied raw observations per group, or five-number summaries with their convention in Vizify and send the request to begin. The account’s current chart access and credit rules apply to generation and revisions.